[blackcat] L2 Ehlers Automatic SineTrend Trading SystemLevel: 2
Background
John F. Ehlers introuced Automatic SineTrend Trading System in his "Rocket Science for Traders" chapter 12.
Function
blackcat L2 Ehlers Automatic SineTrend Trading System is used to find proper long and short entries.Dr. Ehlers developed a completely automatic trading system called the SineTrend Automatic System based on the rules in his book. His fundamental approach is to trade using the Trend Mode rules when the market is in a Trend Mode and trade using the Cycle Mode rules when the market is in a Cycle Mode.
Key Signal
Smooth --> 4 bar WMA w/ 1 bar lag
Detrender --> The amplitude response of a minimum-length HT can be improved by adjusting the filter coefficients by
trial and error. HT does not allow DC component at zero frequency for transformation. So, Detrender is used to remove DC component/ trend component.
Q1 --> Quadrature phase signal
I1 --> In-phase signal
Period --> Dominant Cycle in bars
SmoothPeriod --> Period with complex averaging
DCPeriod ---> Dominant Cycle Period
Trendline ---> IT fast line
SmoothPrice ---> IT slow line
Trend ---> Trend identifier: 1 for trend; 0 for cycle.
LeadSine ---> Lead Sine Wave signal
DCSine ---> Sine Wave signal
long ---> long entry signal
short ---> short entry signal
Pros and Cons
100% John F. Ehlers definition translation of original work, even variable names are the same. This help readers who would like to use pine to read his book. If you had read his works, then you will be quite familiar with my code style.
NOTE: Due to limited performance oberved from "Market Mode Identification" part, this trading system I observed was not so powerful.
Remarks
The 11th script for Blackcat1402 John F. Ehlers Week publication.
Readme
In real life, I am a prolific inventor. I have successfully applied for more than 60 international and regional patents in the past 12 years. But in the past two years or so, I have tried to transfer my creativity to the development of trading strategies. Tradingview is the ideal platform for me. I am selecting and contributing some of the hundreds of scripts to publish in Tradingview community. Welcome everyone to interact with me to discuss these interesting pine scripts.
The scripts posted are categorized into 5 levels according to my efforts or manhours put into these works.
Level 1 : interesting script snippets or distinctive improvement from classic indicators or strategy. Level 1 scripts can usually appear in more complex indicators as a function module or element.
Level 2 : composite indicator/strategy. By selecting or combining several independent or dependent functions or sub indicators in proper way, the composite script exhibits a resonance phenomenon which can filter out noise or fake trading signal to enhance trading confidence level.
Level 3 : comprehensive indicator/strategy. They are simple trading systems based on my strategies. They are commonly containing several or all of entry signal, close signal, stop loss, take profit, re-entry, risk management, and position sizing techniques. Even some interesting fundamental and mass psychological aspects are incorporated.
Level 4 : script snippets or functions that do not disclose source code. Interesting element that can reveal market laws and work as raw material for indicators and strategies. If you find Level 1~2 scripts are helpful, Level 4 is a private version that took me far more efforts to develop.
Level 5 : indicator/strategy that do not disclose source code. private version of Level 3 script with my accumulated script processing skills or a large number of custom functions. I had a private function library built in past two years. Level 5 scripts use many of them to achieve private trading strategy.
在腳本中搜尋"THE SCRIPT"

[blackcat] L2 Ehlers Market Mode IdentifierLevel: 2
Background
John F. Ehlers introuced Market Mode Identifier in his "Rocket Science for Traders" chapter 11. The simplified model of the market, derived from the Drunkard's Walk problem, has only two modes-the Cycle Mode and the Trend Mode. Through the derivation of the Sinewave Indicator and the Instantaneous Trendline, Ehlers had shown several ways to estimate which mode the market may have for a given moment. As with most technical indicators, the decision point between modes is not clear-cut. In fact, trying to automate the decision often leads to a great deal of chatter and rapid back and
forth switching of decisions.
Function
blackcat L2 Ehlers Market Mode Identifier is used to identify market status is in Trend Mode or Cycle Mode.Since the Cycle Mode exists for the smallest fraction of time and since most traders make the most money following a trend rather than a cycle, it is best to assume that the market is in a Trend Mode unless some very specific criteria are met. There are only two criteria to establish a Cycle Mode. First, a Cycle Mode exists for the period of a half-dominant cycle after the crossing of the two Sinewave Indicator lines. Second, a Cycle Mode exists if the measured phase rate of change is more than two-thirds the phase rate of change of the dominant cycle (2*pi /Period) and is less
than 1.5 times the phase rate of change of the dominant cycle. There is another condition that defines a Trend Mode. This condition is derived from pragmatic observation, not theoretical considerations. When the market makes a major reversal, it often does this with great vigor. When this occurs, the prices have a wide separation from the Instantaneous Trendline. When the prices are widely separated from the Instantaneous Trendline, it is possible for the Cycle Mode conditions to be met-but the Cycle Mode identification is clearly incorrect. Dr. Ehlers have therefore inserted another overriding rule for these cases. That rule is that if the SmoothPrice (the 4-bar WMA of the Price) is separated by more than 1.5 percent from the Instantaneous Trendline, then the correct market mode is the Trend Mode.
Key Signal
Smooth --> 4 bar WMA w/ 1 bar lag
Detrender --> The amplitude response of a minimum-length HT can be improved by adjusting the filter coefficients by
trial and error. HT does not allow DC component at zero frequency for transformation. So, Detrender is used to remove DC component/ trend component.
Q1 --> Quadrature phase signal
I1 --> In-phase signal
Period --> Dominant Cycle in bars
SmoothPeriod --> Period with complex averaging
DCPeriod ---> Dominant Cycle Period
Trendline ---> IT fast line
SmoothPrice ---> IT slow line
Trend ---> Trend identifier: 1 for trend; 0 for cycle.
Pros and Cons
100% John F. Ehlers definition translation of original work, even variable names are the same. This help readers who would like to use pine to read his book. If you had read his works, then you will be quite familiar with my code style.
NOTE: I had tried several time frames, and found it did not work well for time frame < 1W.
Remarks
The 10th script for Blackcat1402 John F. Ehlers Week publication.
Readme
In real life, I am a prolific inventor. I have successfully applied for more than 60 international and regional patents in the past 12 years. But in the past two years or so, I have tried to transfer my creativity to the development of trading strategies. Tradingview is the ideal platform for me. I am selecting and contributing some of the hundreds of scripts to publish in Tradingview community. Welcome everyone to interact with me to discuss these interesting pine scripts.
The scripts posted are categorized into 5 levels according to my efforts or manhours put into these works.
Level 1 : interesting script snippets or distinctive improvement from classic indicators or strategy. Level 1 scripts can usually appear in more complex indicators as a function module or element.
Level 2 : composite indicator/strategy. By selecting or combining several independent or dependent functions or sub indicators in proper way, the composite script exhibits a resonance phenomenon which can filter out noise or fake trading signal to enhance trading confidence level.
Level 3 : comprehensive indicator/strategy. They are simple trading systems based on my strategies. They are commonly containing several or all of entry signal, close signal, stop loss, take profit, re-entry, risk management, and position sizing techniques. Even some interesting fundamental and mass psychological aspects are incorporated.
Level 4 : script snippets or functions that do not disclose source code. Interesting element that can reveal market laws and work as raw material for indicators and strategies. If you find Level 1~2 scripts are helpful, Level 4 is a private version that took me far more efforts to develop.
Level 5 : indicator/strategy that do not disclose source code. private version of Level 3 script with my accumulated script processing skills or a large number of custom functions. I had a private function library built in past two years. Level 5 scripts use many of them to achieve private trading strategy.

[blackcat] L2 Ehlers Instantaneous TrendlineLevel: 2
Background
John F. Ehlers introuced Instantaneous Trendline (IT) in his "Rocket Science for Traders" chapter 10. Dr. Ehlers hope IT can enable us to compute a continuous trendline from which we can rapidly assess market action.
Function
blackcat L2 Ehlers Instantaneous Trendline (IT) is used to follow trend. IT is important because the dominant cycle component is always notched out. It follows that if the composite analytic waveform consists of only a trend component and a cycle component, and if we remove the cycle component, the residual must be the trend. Of course, this is not precisely true in reality, because there will always be components other than the dominant cycle present. However, this is a workable solution for trading purposes because the secondary cycles usually have a small amplitude.
Key Signal
Smooth --> 4 bar WMA w/ 1 bar lag
Detrender --> The amplitude response of a minimum-length HT can be improved by adjusting the filter coefficients by
trial and error. HT does not allow DC component at zero frequency for transformation. So, Detrender is used to remove DC component/ trend component.
Q1 --> Quadrature phase signal
I1 --> In-phase signal
Period --> Dominant Cycle in bars
SmoothPeriod --> Period with complex averaging
DCPeriod ---> Dominant Cycle Period
Trendline ---> IT fast line
SmoothPrice ---> IT slow line
Pros and Cons
100% John F. Ehlers definition translation of original work, even variable names are the same. This help readers who would like to use pine to read his book. If you had read his works, then you will be quite familiar with my code style.
Remarks
The 9th script for Blackcat1402 John F. Ehlers Week publication.
Readme
In real life, I am a prolific inventor. I have successfully applied for more than 60 international and regional patents in the past 12 years. But in the past two years or so, I have tried to transfer my creativity to the development of trading strategies. Tradingview is the ideal platform for me. I am selecting and contributing some of the hundreds of scripts to publish in Tradingview community. Welcome everyone to interact with me to discuss these interesting pine scripts.
The scripts posted are categorized into 5 levels according to my efforts or manhours put into these works.
Level 1 : interesting script snippets or distinctive improvement from classic indicators or strategy. Level 1 scripts can usually appear in more complex indicators as a function module or element.
Level 2 : composite indicator/strategy. By selecting or combining several independent or dependent functions or sub indicators in proper way, the composite script exhibits a resonance phenomenon which can filter out noise or fake trading signal to enhance trading confidence level.
Level 3 : comprehensive indicator/strategy. They are simple trading systems based on my strategies. They are commonly containing several or all of entry signal, close signal, stop loss, take profit, re-entry, risk management, and position sizing techniques. Even some interesting fundamental and mass psychological aspects are incorporated.
Level 4 : script snippets or functions that do not disclose source code. Interesting element that can reveal market laws and work as raw material for indicators and strategies. If you find Level 1~2 scripts are helpful, Level 4 is a private version that took me far more efforts to develop.
Level 5 : indicator/strategy that do not disclose source code. private version of Level 3 script with my accumulated script processing skills or a large number of custom functions. I had a private function library built in past two years. Level 5 scripts use many of them to achieve private trading strategy.

[blackcat] L2 Ehlers Sine Wave IndicatorLevel: 2
Background
John F. Ehlers introuced Sine Wave Indicator in his "Rocket Science for Traders" chapter 9.
Function
blackcat L2 Ehlers Sine Wave Indicator compared to conventional oscillators such as the Stochastic or Relative Strength Indicator (RSI), the Sinewave Indicator has two major advantages. These are
1. The Sinewave Indicator anticipates the Cycle Mode turning point rather than waiting for confirmation.
2. The phase does not advance when the market is in a Trend Mode. Therefore, the Sinewave Indicator tends to not give false whipsaw signals when the market is in a Trend Mode.
An additional advantage is that the anticipation signal is obtained strictly by mathematically advancing the phase. Momentum is not employed. Therefore, the Sinewave Indicator signals are no more noisy than the original signal.
Key Signal
Smooth --> 4 bar WMA w/ 1 bar lag
Detrender --> The amplitude response of a minimum-length HT can be improved by adjusting the filter coefficients by
trial and error. HT does not allow DC component at zero frequency for transformation. So, Detrender is used to remove DC component/ trend component.
Q1 --> Quadrature phase signal
I1 --> In-phase signal
Period --> Dominant Cycle in bars
SmoothPeriod --> Period with complex averaging
DCPhase ---> dominant cycle phase for sine wave
Pros and Cons
100% John F. Ehlers definition translation of original work, even variable names are the same. This help readers who would like to use pine to read his book. If you had read his works, then you will be quite familiar with my code style.
Remarks
The 8th script for Blackcat1402 John F. Ehlers Week publication.
Readme
In real life, I am a prolific inventor. I have successfully applied for more than 60 international and regional patents in the past 12 years. But in the past two years or so, I have tried to transfer my creativity to the development of trading strategies. Tradingview is the ideal platform for me. I am selecting and contributing some of the hundreds of scripts to publish in Tradingview community. Welcome everyone to interact with me to discuss these interesting pine scripts.
The scripts posted are categorized into 5 levels according to my efforts or manhours put into these works.
Level 1 : interesting script snippets or distinctive improvement from classic indicators or strategy. Level 1 scripts can usually appear in more complex indicators as a function module or element.
Level 2 : composite indicator/strategy. By selecting or combining several independent or dependent functions or sub indicators in proper way, the composite script exhibits a resonance phenomenon which can filter out noise or fake trading signal to enhance trading confidence level.
Level 3 : comprehensive indicator/strategy. They are simple trading systems based on my strategies. They are commonly containing several or all of entry signal, close signal, stop loss, take profit, re-entry, risk management, and position sizing techniques. Even some interesting fundamental and mass psychological aspects are incorporated.
Level 4 : script snippets or functions that do not disclose source code. Interesting element that can reveal market laws and work as raw material for indicators and strategies. If you find Level 1~2 scripts are helpful, Level 4 is a private version that took me far more efforts to develop.
Level 5 : indicator/strategy that do not disclose source code. private version of Level 3 script with my accumulated script processing skills or a large number of custom functions. I had a private function library built in past two years. Level 5 scripts use many of them to achieve private trading strategy.
[blackcat] L2 Ehlers Hilbert OscillatorLevel: 2
Background
John F. Ehlers introuced Hilbert Oscillator in his "Rocket Science for Traders" chapter 8. The Hilbert Oscillator identifies every major turning point.
Function
blackcat L2 Ehlers Hilbert Oscillator is used to follow the trend. Although it will not be a leading indicator because of the 2-bar lag required to compute Q3, it does prove itself to be superior to most currently available oscillators. The bandwidth for the computation of Value1 is twice the bandwidth of I3. Therefore, the amplitude compensation will be less, approximately the square root of 1.57, which is about 1.25. The Hilbert Oscillator identifies every major turning point.
Key Signal
Smooth --> 4 bar WMA w/ 1 bar lag
Detrender --> The amplitude response of a minimum-length HT can be improved by adjusting the filter coefficients by
trial and error. HT does not allow DC component at zero frequency for transformation. So, Detrender is used to remove DC component/ trend component.
Q1 --> Quadrature phase signal
I1 --> In-phase signal
Value1 ---> Hilbert Oscillator fast line
I3 ---> Hilbert Oscillator slow line
Pros and Cons
100% John F. Ehlers definition translation of original work, even variable names are the same. This help readers who would like to use pine to read his book. If you had read his works, then you will be quite familiar with my code style.
Remarks
The 7th script for Blackcat1402 John F. Ehlers Week publication.
Readme
In real life, I am a prolific inventor. I have successfully applied for more than 60 international and regional patents in the past 12 years. But in the past two years or so, I have tried to transfer my creativity to the development of trading strategies. Tradingview is the ideal platform for me. I am selecting and contributing some of the hundreds of scripts to publish in Tradingview community. Welcome everyone to interact with me to discuss these interesting pine scripts.
The scripts posted are categorized into 5 levels according to my efforts or manhours put into these works.
Level 1 : interesting script snippets or distinctive improvement from classic indicators or strategy. Level 1 scripts can usually appear in more complex indicators as a function module or element.
Level 2 : composite indicator/strategy. By selecting or combining several independent or dependent functions or sub indicators in proper way, the composite script exhibits a resonance phenomenon which can filter out noise or fake trading signal to enhance trading confidence level.
Level 3 : comprehensive indicator/strategy. They are simple trading systems based on my strategies. They are commonly containing several or all of entry signal, close signal, stop loss, take profit, re-entry, risk management, and position sizing techniques. Even some interesting fundamental and mass psychological aspects are incorporated.
Level 4 : script snippets or functions that do not disclose source code. Interesting element that can reveal market laws and work as raw material for indicators and strategies. If you find Level 1~2 scripts are helpful, Level 4 is a private version that took me far more efforts to develop.
Level 5 : indicator/strategy that do not disclose source code. private version of Level 3 script with my accumulated script processing skills or a large number of custom functions. I had a private function library built in past two years. Level 5 scripts use many of them to achieve private trading strategy.

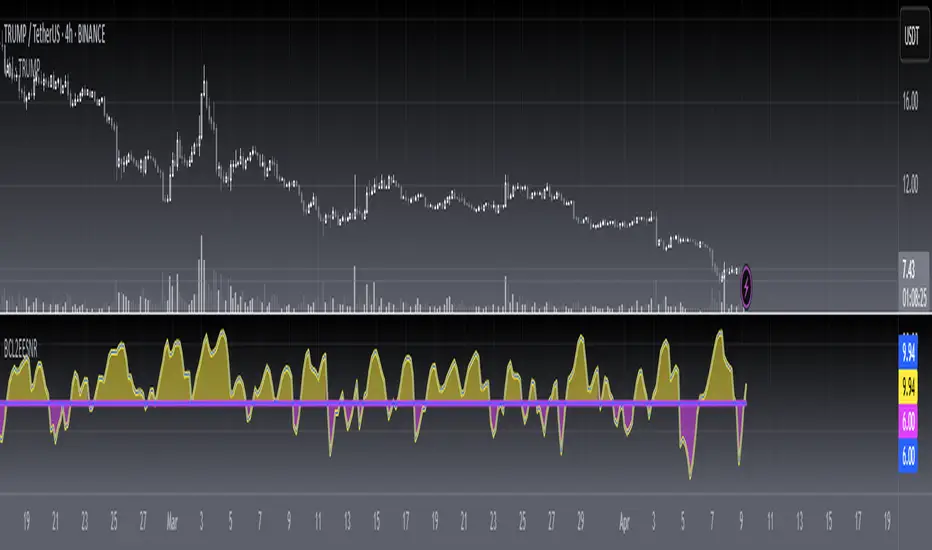
[blackcat] L2 Ehlers Enhanced Signal to Noise IndicatorLevel: 2
Background
John F. Ehlers introuced another Enhanced Signal to Noise Indicator in his "Rocket Science for Traders" chapter 8.
Function
blackcat L2 Ehlers Signal to Noise Indicator is used to measure Signal-to-Noise Ratio (SNR). In this code, the period of the measured dominant cycle is calculated in exactly the same manner as we calculated it for the Primary SNR Indicator. Near the end of the code, after the dominant cycle is determined, Dr. Ehlers computes the SNR. The Quadrature component Q3 is calculated by multiplying the 2-bar momentum of the Weighted Moving Average (WMA) smoothing by the dominant cycle amplitude correction factor.
Key Signal
Smooth --> 4 bar WMA w/ 1 bar lag
Detrender --> The amplitude response of a minimum-length HT can be improved by adjusting the filter coefficients by
trial and error. HT does not allow DC component at zero frequency for transformation. So, Detrender is used to remove DC component/ trend component.
Q1 --> Quadrature phase signal
I1 --> In-phase signal
Period --> Dominant Cycle in bars
SNR --> Signal-to-Noise Ratio
Pros and Cons
100% John F. Ehlers definition translation of original work, even variable names are the same. This help readers who would like to use pine to read his book. If you had read his works, then you will be quite familiar with my code style.
Remarks
The 6th script for Blackcat1402 John F. Ehlers Week publication.
Readme
In real life, I am a prolific inventor. I have successfully applied for more than 60 international and regional patents in the past 12 years. But in the past two years or so, I have tried to transfer my creativity to the development of trading strategies. Tradingview is the ideal platform for me. I am selecting and contributing some of the hundreds of scripts to publish in Tradingview community. Welcome everyone to interact with me to discuss these interesting pine scripts.
The scripts posted are categorized into 5 levels according to my efforts or manhours put into these works.
Level 1 : interesting script snippets or distinctive improvement from classic indicators or strategy. Level 1 scripts can usually appear in more complex indicators as a function module or element.
Level 2 : composite indicator/strategy. By selecting or combining several independent or dependent functions or sub indicators in proper way, the composite script exhibits a resonance phenomenon which can filter out noise or fake trading signal to enhance trading confidence level.
Level 3 : comprehensive indicator/strategy. They are simple trading systems based on my strategies. They are commonly containing several or all of entry signal, close signal, stop loss, take profit, re-entry, risk management, and position sizing techniques. Even some interesting fundamental and mass psychological aspects are incorporated.
Level 4 : script snippets or functions that do not disclose source code. Interesting element that can reveal market laws and work as raw material for indicators and strategies. If you find Level 1~2 scripts are helpful, Level 4 is a private version that took me far more efforts to develop.
Level 5 : indicator/strategy that do not disclose source code. private version of Level 3 script with my accumulated script processing skills or a large number of custom functions. I had a private function library built in past two years. Level 5 scripts use many of them to achieve private trading strategy.
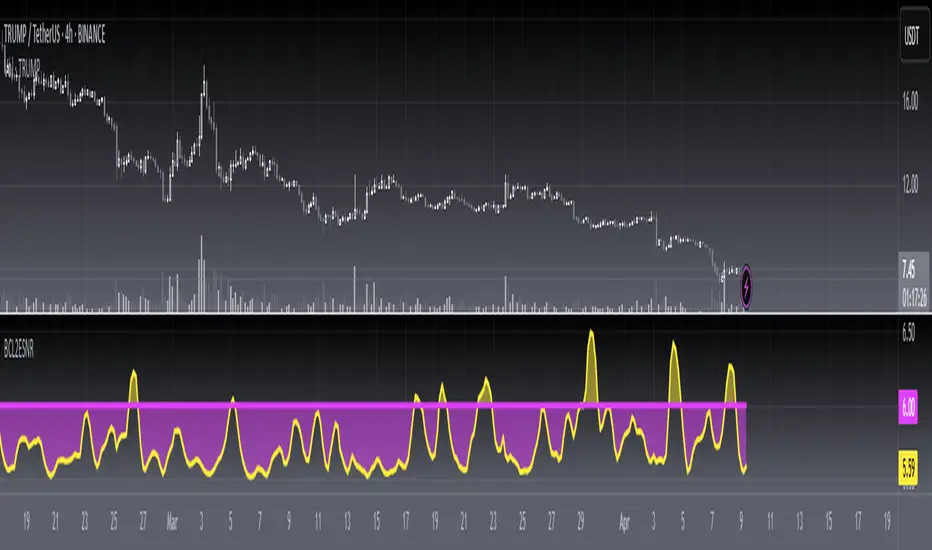
[blackcat] L2 Ehlers Signal to Noise IndicatorLevel: 2
Background
John F. Ehlers introuced Signal to Noise Indicator in his "Rocket Science for Traders" chapter 8. Dr. Ehlers terms the case where half the average daily trading range is equal to the signal amplitude as our zero decibel Signal-to-Noise Ratio (0 dB SNR) condition. He wants the signal amplitude to be at least twice the noise amplitude (6dB SNR) so that there exists a reasonable chance to make a profit from the chart analysis.
Function
blackcat L2 Ehlers Signal to Noise Indicator is used to measure Signal-to-Noise Ratio (SNR). The SNR in decibels is calculated in a single line of code near the end. The signal power is divided by the noise power to get a power ratio. The logarithm of the power ratio. At 0 dB, the peak-to-peak noise signal is twice the amplitude of the signal. Therefore, when we compute the 0 dB case, the ratio is calculated to be 10*log(1/2)^2 = -6 dB. We must then add 6 dB back into the computation to remove this bias, establishing the definition of 0 dB SNR.
Key Signal
Smooth --> 4 bar WMA w/ 1 bar lag
Detrender --> The amplitude response of a minimum-length HT can be improved by adjusting the filter coefficients by
trial and error. HT does not allow DC component at zero frequency for transformation. So, Detrender is used to remove DC component/ trend component.
Q1 --> Quadrature phase signal
I1 --> In-phase signal
Period --> Dominant Cycle in bars
SNR --> Signal-to-Noise Ratio
Pros and Cons
100% John F. Ehlers definition translation of original work, even variable names are the same. This help readers who would like to use pine to read his book. If you had read his works, then you will be quite familiar with my code style.
Remarks
The 5th script for Blackcat1402 John F. Ehlers Week publication.
Readme
In real life, I am a prolific inventor. I have successfully applied for more than 60 international and regional patents in the past 12 years. But in the past two years or so, I have tried to transfer my creativity to the development of trading strategies. Tradingview is the ideal platform for me. I am selecting and contributing some of the hundreds of scripts to publish in Tradingview community. Welcome everyone to interact with me to discuss these interesting pine scripts.
The scripts posted are categorized into 5 levels according to my efforts or manhours put into these works.
Level 1 : interesting script snippets or distinctive improvement from classic indicators or strategy. Level 1 scripts can usually appear in more complex indicators as a function module or element.
Level 2 : composite indicator/strategy. By selecting or combining several independent or dependent functions or sub indicators in proper way, the composite script exhibits a resonance phenomenon which can filter out noise or fake trading signal to enhance trading confidence level.
Level 3 : comprehensive indicator/strategy. They are simple trading systems based on my strategies. They are commonly containing several or all of entry signal, close signal, stop loss, take profit, re-entry, risk management, and position sizing techniques. Even some interesting fundamental and mass psychological aspects are incorporated.
Level 4 : script snippets or functions that do not disclose source code. Interesting element that can reveal market laws and work as raw material for indicators and strategies. If you find Level 1~2 scripts are helpful, Level 4 is a private version that took me far more efforts to develop.
Level 5 : indicator/strategy that do not disclose source code. private version of Level 3 script with my accumulated script processing skills or a large number of custom functions. I had a private function library built in past two years. Level 5 scripts use many of them to achieve private trading strategy.
[blackcat] L2 Ehlers Dual Differential Cycle Period MeasurerLevel: 2
Background
John F. Ehlers introuced Dual Differential Cycle Period Measurer in his "Rocket Science for Traders" chapter 7. The In-phase and Quadrature components are computed with the Hilbert Transformer using procedures identical to those in the Dual Differentiator.
Function
blackcat L2 Ehlers Homodyne Discriminator Cycle Period Measurer is used to measure Dominant Cycle (DC). This is one of John Ehlers three major methods to measure DC. These components undergo a complex averaging and are smoothed in an EMA to avoid any undesired cross products in the multiplication step that follows. The period is solved directly from the smoothed Inphase and Quadrature components. The interim calculation for the denominator is performed as Value1 to ensure that the denominator will not have a zero value. The sign of Valuel is reversed relative to the theoretical equation because the differences are looking backward in time.
Key Signal
Smooth --> 4 bar WMA w/ 1 bar lag
Detrender --> The amplitude response of a minimum-length HT can be improved by adjusting the filter coefficients by
trial and error. HT does not allow DC component at zero frequency for transformation. So, Detrender is used to remove DC component/ trend component.
Q1 --> Quadrature phase signal
I1 --> In-phase signal
Period --> Dominant Cycle in bars
SmoothPeriod --> Period with complex averaging
Pros and Cons
100% John F. Ehlers definition translation of original work, even variable names are the same. This help readers who would like to use pine to read his book. If you had read his works, then you will be quite familiar with my code style.
Remarks
The 4th script for Blackcat1402 John F. Ehlers Week publication.
Readme
In real life, I am a prolific inventor. I have successfully applied for more than 60 international and regional patents in the past 12 years. But in the past two years or so, I have tried to transfer my creativity to the development of trading strategies. Tradingview is the ideal platform for me. I am selecting and contributing some of the hundreds of scripts to publish in Tradingview community. Welcome everyone to interact with me to discuss these interesting pine scripts.
The scripts posted are categorized into 5 levels according to my efforts or manhours put into these works.
Level 1 : interesting script snippets or distinctive improvement from classic indicators or strategy. Level 1 scripts can usually appear in more complex indicators as a function module or element.
Level 2 : composite indicator/strategy. By selecting or combining several independent or dependent functions or sub indicators in proper way, the composite script exhibits a resonance phenomenon which can filter out noise or fake trading signal to enhance trading confidence level.
Level 3 : comprehensive indicator/strategy. They are simple trading systems based on my strategies. They are commonly containing several or all of entry signal, close signal, stop loss, take profit, re-entry, risk management, and position sizing techniques. Even some interesting fundamental and mass psychological aspects are incorporated.
Level 4 : script snippets or functions that do not disclose source code. Interesting element that can reveal market laws and work as raw material for indicators and strategies. If you find Level 1~2 scripts are helpful, Level 4 is a private version that took me far more efforts to develop.
Level 5 : indicator/strategy that do not disclose source code. private version of Level 3 script with my accumulated script processing skills or a large number of custom functions. I had a private function library built in past two years. Level 5 scripts use many of them to achieve private trading strategy.
[blackcat] L2 Ehlers Homodyne Discriminator Period MeasurerLevel: 2
Background
John F. Ehlers introuced Homodyne Discriminator Cycle Period Measurer in his "Rocket Science for Traders" chapter 7. Homodyne means we are multiplying the signal by itself. More precise, we want to multiply the signal of the current bar with the complex conjugate of the signal 1 bar ago. The complex conjugate is, by definition, a complex number whose sign of the imaginary component has been reversed.
Function
blackcat L2 Ehlers Homodyne Discriminator Cycle Period Measurer is used to measure Dominant Cycle (DC). This is one of John Ehlers three major methods to measure DC. Mode. Dr. Ehlers conclude that the Homodyne is overall more accurate in measurement of cycles when the market is in a Trend Mode. For all these reasons Dr. Ehlers conclude that the Homodyne Discriminator is the superior approach among the three methods.
Key Signal
Smooth --> 4 bar WMA w/ 1 bar lag
Detrender --> The amplitude response of a minimum-length HT can be improved by adjusting the filter coefficients by
trial and error. HT does not allow DC component at zero frequency for transformation. So, Detrender is used to remove DC component/ trend component.
Q1 --> Quadrature phase signal
I1 --> In-phase signal
Period --> Dominant Cycle in bars
SmoothPeriod --> Period with complex averaging
Pros and Cons
100% John F. Ehlers definition translation of original work, even variable names are the same. This help readers who would like to use pine to read his book. If you had read his works, then you will be quite familiar with my code style.
Remarks
The 3rd script for Blackcat1402 John F. Ehlers Week publication.
Readme
In real life, I am a prolific inventor. I have successfully applied for more than 60 international and regional patents in the past 12 years. But in the past two years or so, I have tried to transfer my creativity to the development of trading strategies. Tradingview is the ideal platform for me. I am selecting and contributing some of the hundreds of scripts to publish in Tradingview community. Welcome everyone to interact with me to discuss these interesting pine scripts.
The scripts posted are categorized into 5 levels according to my efforts or manhours put into these works.
Level 1 : interesting script snippets or distinctive improvement from classic indicators or strategy. Level 1 scripts can usually appear in more complex indicators as a function module or element.
Level 2 : composite indicator/strategy. By selecting or combining several independent or dependent functions or sub indicators in proper way, the composite script exhibits a resonance phenomenon which can filter out noise or fake trading signal to enhance trading confidence level.
Level 3 : comprehensive indicator/strategy. They are simple trading systems based on my strategies. They are commonly containing several or all of entry signal, close signal, stop loss, take profit, re-entry, risk management, and position sizing techniques. Even some interesting fundamental and mass psychological aspects are incorporated.
Level 4 : script snippets or functions that do not disclose source code. Interesting element that can reveal market laws and work as raw material for indicators and strategies. If you find Level 1~2 scripts are helpful, Level 4 is a private version that took me far more efforts to develop.
Level 5 : indicator/strategy that do not disclose source code. private version of Level 3 script with my accumulated script processing skills or a large number of custom functions. I had a private function library built in past two years. Level 5 scripts use many of them to achieve private trading strategy.
[blackcat] L2 Ehlers Phase Accumulator Cycle Period MeasurerLevel: 2
Background
John F. Ehlers introuced Phase Accumulation technique of cycle period measurement in his "Rocket Science for Traders" chapter 7. It is perhaps the easiest to comprehend. In this technique, John Ehlers measures the phase at each sample by taking the arctangent of the ratio of the Quadrature component to the In-phase component. A delta phase is generated by taking the difference of the phase between successive samples. At each sample Dr. Ehlers then looks backward, adding up the delta phases. When the sum of the delta phases reaches 360 degrees (2*pi in tradingview), we must have passed through one full cycle, on average. The process is repeated for each new sample.
Function
blackcat L2 Ehlers Phase Accumulator Cycle Period Measurer is used to measure Dominant Cycle (DC). This is one of John Ehlers three major methods to measure DC. The Phase Accumulation method of cycle measurement always uses one full cycle’s worth of historical data. This is both an advantage and disadvantage. The advantage is the lag in obtaining the answer scales directly with the cycle period. That is, the measurement of a short cycle period has less lag than the measurement of a longer cycle period. However, the number of samples used in making the measurement means the averaging period is variable with cycle period. Longer averaging reduces the noise level compared to the signal. Therefore, shorter cycle periods necessarily have a higher output Signal-to-Noise Ratio (SNR).
Key Signal
Smooth --> 4 bar WMA w/ 1 bar lag
Detrender --> The amplitude response of a minimum-length HT can be improved by adjusting the filter coefficients by
trial and error. HT does not allow DC component at zero frequency for transformation. So, Detrender is used to remove DC component/ trend component.
Q1 --> Quadrature phase signal
I1 --> In-phase signal
Period --> Dominant Cycle in bars
Pros and Cons
100% John F. Ehlers definition translation of original work, even variable names are the same. This help readers who would like to use pine to read his book. If you had read his works, then you will be quite familiar with my code style.
Remarks
The 2nd script for Blackcat1402 John F. Ehlers Week publication.
Readme
In real life, I am a prolific inventor. I have successfully applied for more than 60 international and regional patents in the past 12 years. But in the past two years or so, I have tried to transfer my creativity to the development of trading strategies. Tradingview is the ideal platform for me. I am selecting and contributing some of the hundreds of scripts to publish in Tradingview community. Welcome everyone to interact with me to discuss these interesting pine scripts.
The scripts posted are categorized into 5 levels according to my efforts or manhours put into these works.
Level 1 : interesting script snippets or distinctive improvement from classic indicators or strategy. Level 1 scripts can usually appear in more complex indicators as a function module or element.
Level 2 : composite indicator/strategy. By selecting or combining several independent or dependent functions or sub indicators in proper way, the composite script exhibits a resonance phenomenon which can filter out noise or fake trading signal to enhance trading confidence level.
Level 3 : comprehensive indicator/strategy. They are simple trading systems based on my strategies. They are commonly containing several or all of entry signal, close signal, stop loss, take profit, re-entry, risk management, and position sizing techniques. Even some interesting fundamental and mass psychological aspects are incorporated.
Level 4 : script snippets or functions that do not disclose source code. Interesting element that can reveal market laws and work as raw material for indicators and strategies. If you find Level 1~2 scripts are helpful, Level 4 is a private version that took me far more efforts to develop.
Level 5 : indicator/strategy that do not disclose source code. private version of Level 3 script with my accumulated script processing skills or a large number of custom functions. I had a private function library built in past two years. Level 5 scripts use many of them to achieve private trading strategy.

[blackcat] L2 Ehlers Hilbert TransformLevel: 2
Background
John F. Ehlers introuced Hilbert Transform in his "Rocket Science for Traders" chapter 6. The Hilbert Transform is a procedure to create complex signals from the simple chart data familiar to all traders. Once we have the complex signals, we can compute indicators and signals that are more accurate and responsive than those computed using conventional techniques. In fact, some of the indicators we will discuss cannot be calculated at all without the Hilbert Transform.
Function
blackcat L2 Ehlers Hilbert Transform indicator performs basic Hilbert Transform (HT) from chart data source and generate complex IQ data.
Key Signal
Smooth --> 4 bar wma() w/ 1 bar lag
Detrender --> The amplitude response of a minimum-length HT can be improved by adjusting the filter coefficients by
trial and error. HT does not allow DC component at zero frequency for transformation. So, Detrender is used to remove DC component/ trend component.
Q1 --> Quadrature phase output signal
I1 --> In-phase output signal
Pros and Cons
100% John F. Ehlers definition translation, even variable names are the same. This help readers who would like to use pine to read his book.
Remarks
The 1st script for Blackcat1402 John F. Ehlers Week publication.
Readme
In real life, I am a prolific inventor. I have successfully applied for more than 60 international and regional patents in the past 12 years. But in the past two years or so, I have tried to transfer my creativity to the development of trading strategies. Tradingview is the ideal platform for me. I am selecting and contributing some of the hundreds of scripts to publish in Tradingview community. Welcome everyone to interact with me to discuss these interesting pine scripts.
The scripts posted are categorized into 5 levels according to my efforts or manhours put into these works.
Level 1 : interesting script snippets or distinctive improvement from classic indicators or strategy. Level 1 scripts can usually appear in more complex indicators as a function module or element.
Level 2 : composite indicator/strategy. By selecting or combining several independent or dependent functions or sub indicators in proper way, the composite script exhibits a resonance phenomenon which can filter out noise or fake trading signal to enhance trading confidence level.
Level 3 : comprehensive indicator/strategy. They are simple trading systems based on my strategies. They are commonly containing several or all of entry signal, close signal, stop loss, take profit, re-entry, risk management, and position sizing techniques. Even some interesting fundamental and mass psychological aspects are incorporated.
Level 4 : script snippets or functions that do not disclose source code. Interesting element that can reveal market laws and work as raw material for indicators and strategies. If you find Level 1~2 scripts are helpful, Level 4 is a private version that took me far more efforts to develop.
Level 5 : indicator/strategy that do not disclose source code. private version of Level 3 script with my accumulated script processing skills or a large number of custom functions. I had a private function library built in past two years. Level 5 scripts use many of them to achieve private trading strategy.

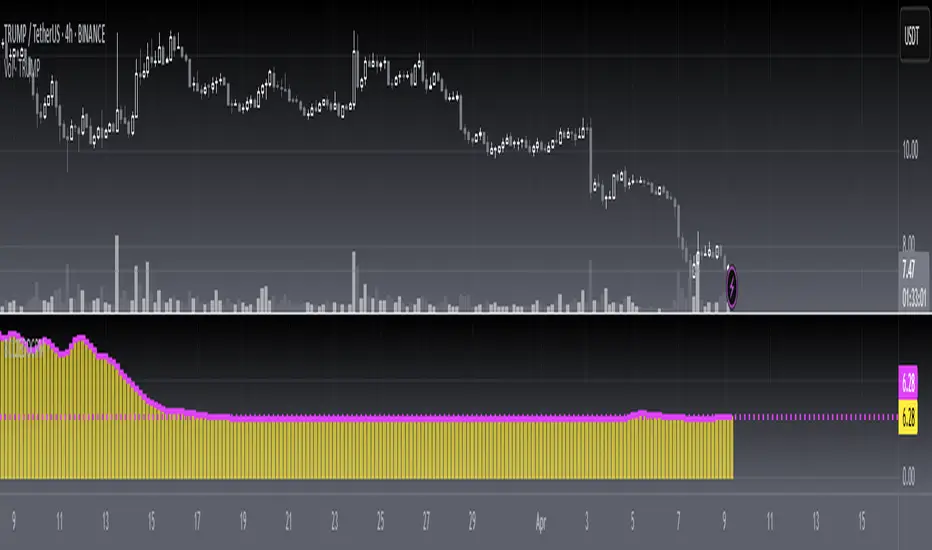
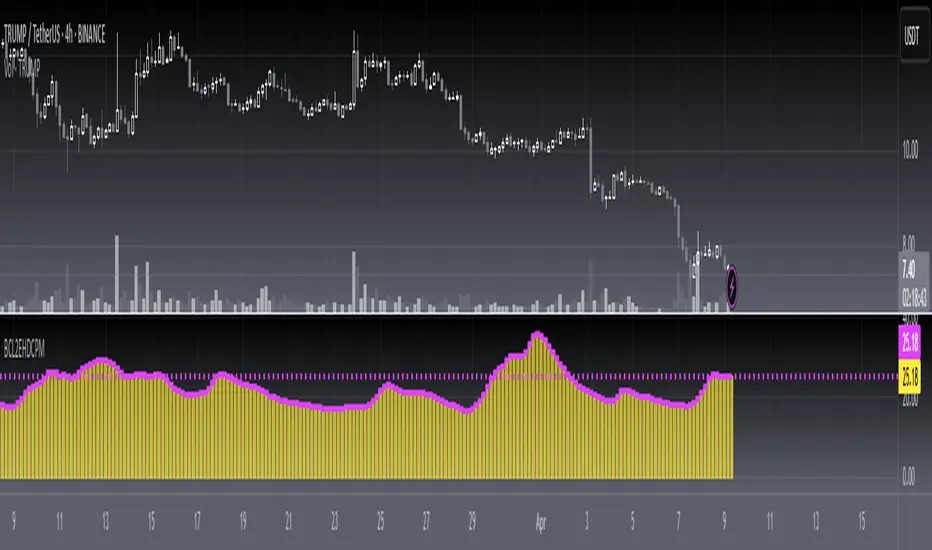
[blackcat] L1 Bitcoin Guppy Whale Pump Dump OscillatorLevel: 1
Background
The Guppy Multiple Moving Average (GMMA) is a technical indicator that identifies changing trends, breakouts, and trading opportunities in the price of an asset by combining two sets of moving averages (MA) with different time periods. There is a short term group of MAs and a long term group of MAs.
One of the biggest differences between cryptocurrency and traditional financial markets is that cryptocurrency is based on blockchain technology. Individual investors can discover the direction of the flow of large funds through on-chain transfers. These large funds are often referred to as Whale. Whale can have a significant impact on the price movements of cryptocurrencies, especially Bitcoin . Therefore, how to monitor Whale trends is of great significance both in terms of fundamentals and technical aspects.
Function
L1 Bitcoin Guppy Whale Pump Dump Oscillator is innovative because it was moved from main chart to aux chart and the input source of Guppy moving average was changed in to bias rate of key EMAs. This makes it work as a Guppy oscillator. This Guppy oscillator was designed and optimized to detect whale pump and dump behavior for BTCUSD or BTCUSDT trading pairs. When whale pump is detected, yellow candles appear; when whale dump is detected, fuchsia candles appear.
Key Signal
di,d1~d8 ---> Guppy oscillator lines
pump --> whale pump detector
dump --> whale dump detector
Pros and Cons
Pros:
1. easy observe price trend
2. it detects whale pump and dump
Cons:
1. no explicit entries are disclosed
2. only optimized for Bitcoin usd/usdt trading pairs
Remarks
Courtesy of @LunaOwl " Rainbow Color Gradient" for colorful Guppy oscillator lines in this script
Readme
In real life, I am a prolific inventor. I have successfully applied for more than 60 international and regional patents in the past 12 years. But in the past two years or so, I have tried to transfer my creativity to the development of trading strategies. Tradingview is the ideal platform for me. I am selecting and contributing some of the hundreds of scripts to publish in Tradingview community. Welcome everyone to interact with me to discuss these interesting pine scripts.
The scripts posted are categorized into 5 levels according to my efforts or manhours put into these works.
Level 1 : interesting script snippets or distinctive improvement from classic indicators or strategy. Level 1 scripts can usually appear in more complex indicators as a function module or element.
Level 2 : composite indicator/strategy. By selecting or combining several independent or dependent functions or sub indicators in proper way, the composite script exhibits a resonance phenomenon which can filter out noise or fake trading signal to enhance trading confidence level.
Level 3 : comprehensive indicator/strategy. They are simple trading systems based on my strategies. They are commonly containing several or all of entry signal, close signal, stop loss, take profit, re-entry, risk management, and position sizing techniques. Even some interesting fundamental and mass psychological aspects are incorporated.
Level 4 : script snippets or functions that do not disclose source code. Interesting element that can reveal market laws and work as raw material for indicators and strategies. If you find Level 1~2 scripts are helpful, Level 4 is a private version that took me far more efforts to develop.
Level 5 : indicator/strategy that do not disclose source code. private version of Level 3 script with my accumulated script processing skills or a large number of custom functions. I had a private function library built in past two years. Level 5 scripts use many of them to achieve private trading strategy.

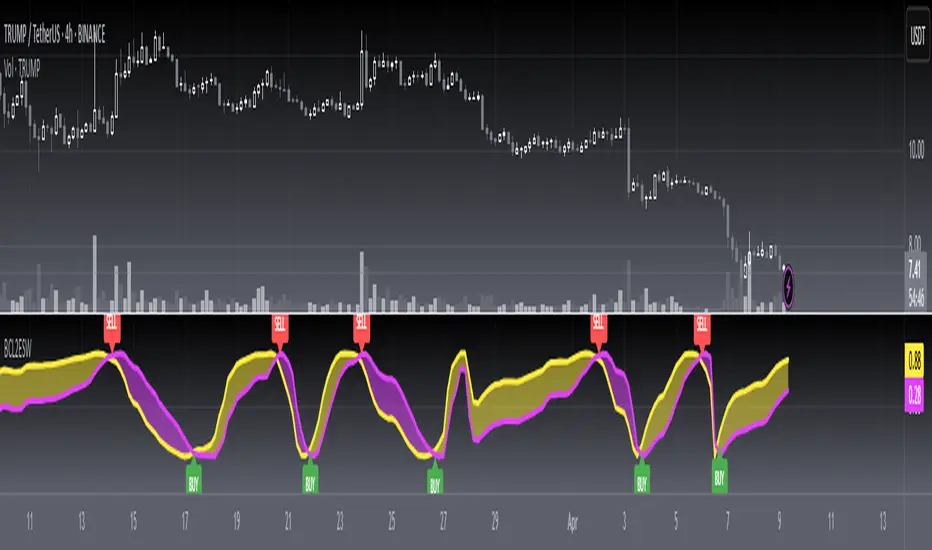
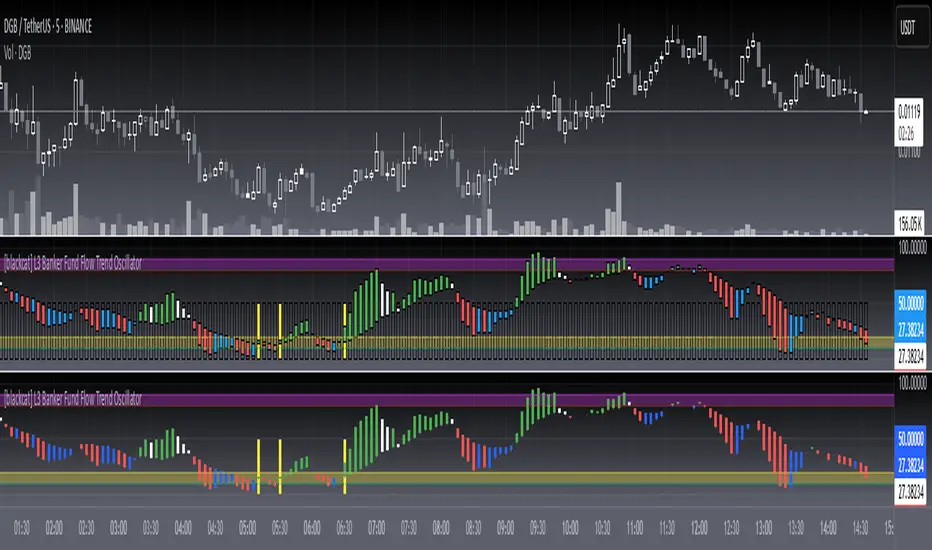
[blackcat] L3 Banker Fund Flow Trend OscillatorLevel: 3
Background
The large funds or banker fund are often referred to as Whale. Whale can have a significant impact on the price movements in various markets, especially in cryptocurrency . Therefore, how to monitor Whale trends is of great significance both in terms of fundamentals and technical aspects.
Function
L3 Banker Fund Flow Trend Oscillator can give you a model of complete banker fund flow operation in cycles. Although the script is not so complicated, it is comprehensive to disclose the price trend. That is the reason why I list this as Level 3. Each cycle of banker fund flow may have 5 steps in max as entry, increase position, decrease position, exit, and weak rebound for exit.
Key Signal
1. banker fund entry with yellow candle
2. banker increase position with green candle
3. banker decrease position with white candle
4. banker fund exit/quit with red candle
5. banker fund weak rebound with blue candle
Pros and Cons
Pros:
1. Model banker fund behavior in complete cycles
2. Overbought and oversold can be directly observed due to oscillator nature
3. the transition points are clear for entry or exit
Cons:
1. Simple modelling, no further complex behaviors can be disclosed
2. trade by trend following the banker fund, it is still under the trend analysis prerequisite
Remarks
I believe you will like this one.
Readme
In real life, I am a prolific inventor. I have successfully applied for more than 60 international and regional patents in the past 12 years. But in the past two years or so, I have tried to transfer my creativity to the development of trading strategies. Tradingview is the ideal platform for me. I am selecting and contributing some of the hundreds of scripts to publish in Tradingview community. Welcome everyone to interact with me to discuss these interesting pine scripts.
The scripts posted are categorized into 5 levels according to my efforts or manhours put into these works.
Level 1 : interesting script snippets or distinctive improvement from classic indicators or strategy. Level 1 scripts can usually appear in more complex indicators as a function module or element.
Level 2 : composite indicator/strategy. By selecting or combining several independent or dependent functions or sub indicators in proper way, the composite script exhibits a resonance phenomenon which can filter out noise or fake trading signal to enhance trading confidence level.
Level 3 : comprehensive indicator/strategy. They are simple trading systems based on my strategies. They are commonly containing several or all of entry signal, close signal, stop loss, take profit, re-entry, risk management, and position sizing techniques. Even some interesting fundamental and mass psychological aspects are incorporated.
Level 4 : script snippets or functions that do not disclose source code. Interesting element that can reveal market laws and work as raw material for indicators and strategies. If you find Level 1~2 scripts are helpful, Level 4 is a private version that took me far more efforts to develop.
Level 5 : indicator/strategy that do not disclose source code. private version of Level 3 script with my accumulated script processing skills or a large number of custom functions. I had a private function library built in past two years. Level 5 scripts use many of them to achieve private trading strategy.
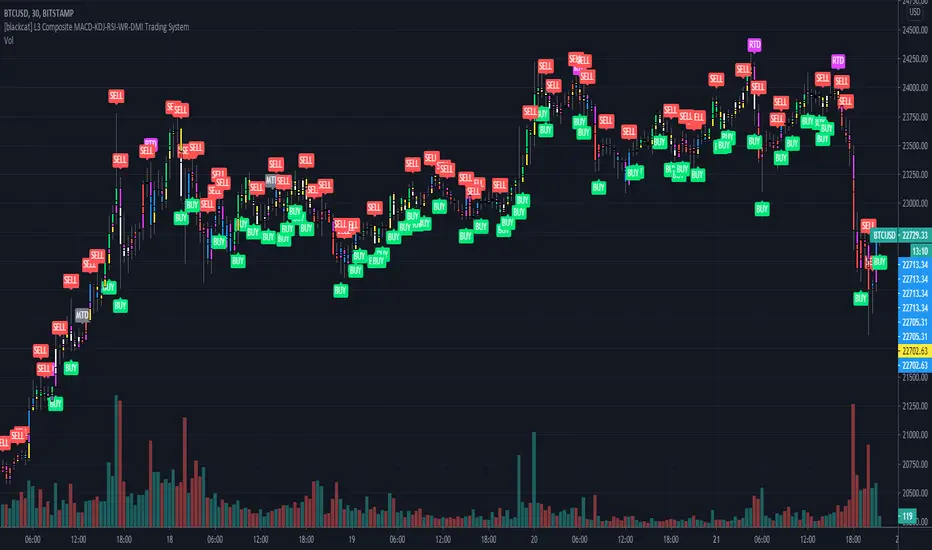
[blackcat] L3 Composite MACD-KDJ-RSI-WR-DMI Trading SystemLevel: 3
Background
The moving average convergence / divergence (MACD) indicator is a pulse oscillator that is mainly used to trade trends. Although it is an oscillator, it is not typically used to identify overbought or oversold conditions. It appears in the diagram as two lines that oscillate without limits. The crossing of the two lines provides trading signals similar to a system with two moving averages.
The KDJ indicator is a technical indicator used to analyze and predict changes in stock performance and the price patterns of a traded asset. The KDJ indicator is also known as the random index. It is a very useful technical indicator that is most commonly used in short term stock market trend analysis. KDJ is a derived form of the Stochastic Oscillator Indicator with the only difference that an additional line is called the J-line. Values of% K and% D indicate whether the security is overbought (over 80) or oversold (under 20). The moments when% K exceeds% D are the moments to sell or buy. The J line represents the deviation of the% D value from% K. The value of J can exceed for the% K and% D lines on the graph.
The Relative Strength Index (RSI) developed by J. Welles Wilder is a pulse oscillator that measures the speed and change of price movements. The RSI hovers between zero and 100. Traditionally, the RSI is considered overbought when it is above 70 and oversold when below 30. Signals can be generated by looking for divergences and error fluctuations.
Williams% R, also known as the Williams Percent Range, is a type of momentum indicator that moves between 0 and -100 and measures overbought and oversold levels. The Williams% R can be used to find entry and exit points in the market. The indicator is very similar to the stochastic oscillator and is used in the same way.
The Directional Movement Index (DMI) is an indicator developed by J. Welles Wilder in 1978 to determine in which direction asset prices are moving. The indicator does this by comparing previous highs and lows and drawing two lines: a positive movement line (+DI) and a negative movement line (-DI). The optional third line is called "Directional Movement (DX)" and it shows the difference between the two lines. When +DI is higher than -DI, the upward pressure on the price is greater than the downward pressure. If -DI is higher than +DI, the price will have greater downward pressure. This indicator can help traders assess the trend direction. Crosses between lines are sometimes used as buying and selling signals.
Function
L3 Composite MACD-KDJ-RSI-WR-DMI Trading System is a simple trading system composed of MACD-KDJ-RSI-WR-DMI together. It can produce 6 types of long entries and 3 types of short entries. It utilizes divergence effect from MACD, KDJ and RSI to detect trend reversal. 6 types of Bottom and top divergence labels are displayed in the chart together with "BUY" and "SELL".
NOTE:In order to make the actual label of the chart more clear, this script does not add stop loss and take profit functions and according labels.
Signal
b1~b3 ---> MACD, KDJ, RSI bottom divergence signal respectively, which hint bull trend may start soon.
d1~d3 ---> MACD, KDJ, RSI top divergence signal respectively, which hint bear trend may start soon.
longentry1~6 ---> with composite indicators together, 6 types of long entry signal are produced.
shortentry1~3 ---> with composite indicators together, 3 types of short entry signal are produced.
Pros and Cons
Pros:
1. excellent open-close, long-short entry signal generation with multiple powerful indicators
2. indicator resonance can help to promote the confidence level of signal and divergence alerts
Cons:
1. integration of multiple indicators is not deeply optimized. fake signal may be produced without filtering schemes
2. no range filter is added
Remarks
To celebrate number of followers exceeds 100. This is my first L3 script published.
Readme
In real life, I am a prolific inventor. I have successfully applied for more than 60 international and regional patents in the past 12 years. But in the past two years or so, I have tried to transfer my creativity to the development of trading strategies. Tradingview is the ideal platform for me. I am selecting and contributing some of the hundreds of scripts to publish in Tradingview community. Welcome everyone to interact with me to discuss these interesting pine scripts.
The scripts posted are categorized into 5 levels according to my efforts or manhours put into these works.
Level 1 : interesting script snippets or distinctive improvement from classic indicators or strategy. Level 1 scripts can usually appear in more complex indicators as a function module or element.
Level 2 : composite indicator/strategy. By selecting or combining several independent or dependent functions or sub indicators in proper way, the composite script exhibits a resonance phenomenon which can filter out noise or fake trading signal to enhance trading confidence level.
Level 3 : comprehensive indicator/strategy. They are simple trading systems based on my strategies. They are commonly containing several or all of entry signal, close signal, stop loss, take profit, re-entry, risk management, and position sizing techniques. Even some interesting fundamental and mass psychological aspects are incorporated.
Level 4 : script snippets or functions that do not disclose source code. Interesting element that can reveal market laws and work as raw material for indicators and strategies. If you find Level 1~2 scripts are helpful, Level 4 is a private version that took me far more efforts to develop.
Level 5 : indicator/strategy that do not disclose source code. private version of Level 3 script with my accumulated script processing skills or a large number of custom functions. I had a private function library built in past two years. Level 5 scripts use many of them to achieve private trading strategy.
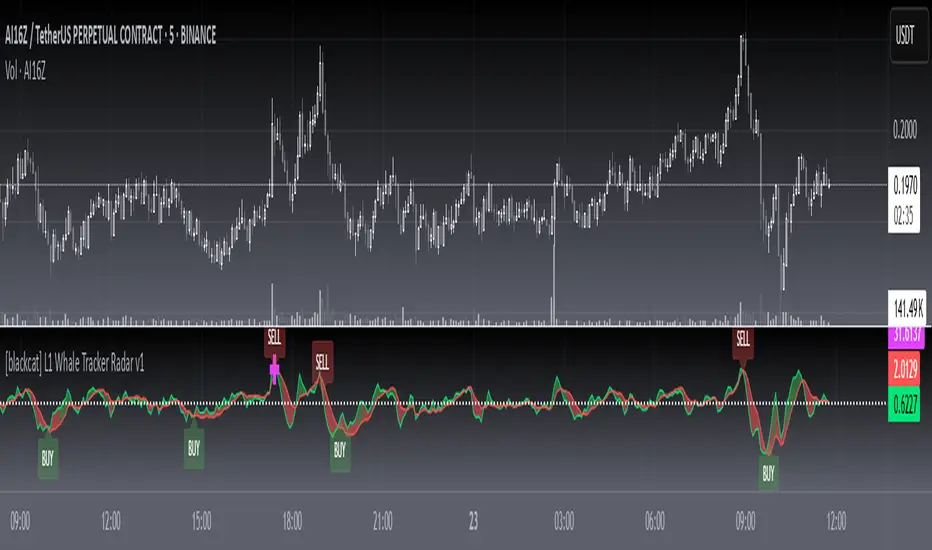
L1 Whale Tracker Radar v1Level: 1
Background
One of the biggest differences between cryptocurrency and traditional financial markets is that cryptocurrency is based on blockchain technology. Individual investors can discover the direction of the flow of large funds through on-chain transfers. These large funds are often referred to as Whale. Whale can have a significant impact on the price movements of cryptocurrencies, especially Bitcoin . Therefore, how to monitor Whale trends is of great significance both in terms of fundamentals and technical aspects.
Function
By modeling the behavior of Whale and individuals, L1 Whale Tracker Radar script can not only simply describe the behavior trends of Whale and individuals, but also generate some simple buying and selling points.
Key Signal
selradar indicates top region is reached.
buyradar indicates bottom region is reached.
buy is the long/xshort entry point suggested.
sell is the short/xlong entry point suggested.
Pros and Cons
Pros:
1. Detect Whale pump and trend.
2. Not a mature and accurate buy and sell script but provide alerts of Whale movements.
3. When it resonante with Buy signal, it has higher confidence level.
Cons:
1. Only use simple moving average to depict Whale behaviors so some info may be missing.
2. It is sensitive and may have noise inside and generate fake signal. BINANCE:BTCUSDT
Remarks
You can use this to confirm blockchain large fund transfer activities. E.g. Large amount of USDT flows into large exchanges.
Readme
In real life, I am a prolific inventor. I have successfully applied for more than 60 international and regional patents in the past 12 years. But in the past two years or so, I have tried to transfer my creativity to the development of trading strategies. Tradingview is the ideal platform for me. I am selecting and contributing some of the hundreds of scripts to publish in Tradingview community. Welcome everyone to interact with me to discuss these interesting pine scripts.
The scripts posted are categorized into 5 levels according to my efforts or manhours put into these works.
Level 1 : interesting script snippets or distinctive improvement from classic indicators or strategy. Level 1 scripts can usually appear in more complex indicators as a function module or element.
Level 2 : composite indicator/strategy. By selecting or combining several independent or dependent functions or sub indicators in proper way, the composite script exhibits a resonance phenomenon which can filter out noise or fake trading signal to enhance trading confidence level.
Level 3 : comprehensive indicator/strategy. They are simple trading systems based on my strategies. They are commonly containing several or all of entry signal, close signal, stop loss, take profit, re-entry, risk management, and position sizing techniques. Even some interesting fundamental and mass psychological aspects are incorporated.
Level 4 : script snippets or functions that do not disclose source code. Interesting element that can reveal market laws and work as raw material for indicators and strategies. If you find Level 1~2 scripts are helpful, Level 4 is a private version that took me far more efforts to develop.
Level 5 : indicator/strategy that do not disclose source code. private version of Level 3 script with my accumulated script processing skills or a large number of custom functions. I had a private function library built in past two years. Level 5 scripts use many of them to achieve private trading strategy.
L1 Bitcoin Whale Pump DetectorLevel: 1
Background
One of the biggest differences between cryptocurrency and traditional financial markets is that cryptocurrency is based on blockchain technology. Individual investors can discover the direction of the flow of large funds through on-chain transfers. These large funds are often referred to as Whale. Whale can have a significant impact on the price movements of cryptocurrencies, especially Bitcoin. Therefore, how to monitor Whale trends is of great significance both in terms of fundamentals and technical aspects.
Function
L1 Bitcoin Whale Pump Detector script This is a simple technical indicator that judges whether Whale is involved in the relationship between price increase and trading volume. Its purpose is not to accurately judge Whale behavior, but to provide a starting point for more Pine lovers to develop more advanced Whale monitoring programs.
Key Signal
pumpcond1 use price information alone with 7% as a threshold
pumpcond2 use both price and volume infomation.
Pros and Cons
Pros:
1. Detect Whale pump in large time frame.
2. Not a mature and accurate buy and sell script but provide alerts of Whale movements.
3. When it resonante with Buy signal, it has higher confidence level.
Cons:
1. Only detect Whale Pump, not Whale Dump is realized.
2. Only provide large fund information, not an accurate trading signal generator.
Remarks
You can use this to confirm blockchain large fund transfer activities. E.g. Large amount of USDT flows into large exchanges.
Readme
In real life, I am a prolific inventor. I have successfully applied for more than 60 international and regional patents in the past 12 years. But in the past two years or so, I have tried to transfer my creativity to the development of trading strategies. Tradingview is the ideal platform for me. I am selecting and contributing some of the hundreds of scripts to publish in Tradingview community. Welcome everyone to interact with me to discuss these interesting pine scripts.
The scripts posted are categorized into 5 levels according to my efforts or manhours put into these works.
Level 1 : interesting script snippets or distinctive improvement from classic indicators or strategy. Level 1 scripts can usually appear in more complex indicators as a function module or element.
Level 2 : composite indicator/strategy. By selecting or combining several independent or dependent functions or sub indicators in proper way, the composite script exhibits a resonance phenomenon which can filter out noise or fake trading signal to enhance trading confidence level.
Level 3 : comprehensive indicator/strategy. They are simple trading systems based on my strategies. They are commonly containing several or all of entry signal, close signal, stop loss, take profit, re-entry, risk management, and position sizing techniques. Even some interesting fundamental and mass psychological aspects are incorporated.
Level 4 : script snippets or functions that do not disclose source code. Interesting element that can reveal market laws and work as raw material for indicators and strategies. If you find Level 1~2 scripts are helpful, Level 4 is a private version that took me far more efforts to develop.
Level 5 : indicator/strategy that do not disclose source code. private version of Level 3 script with my accumulated script processing skills or a large number of custom functions. I had a private function library built in past two years. Level 5 scripts use many of them to achieve private trading strategy.

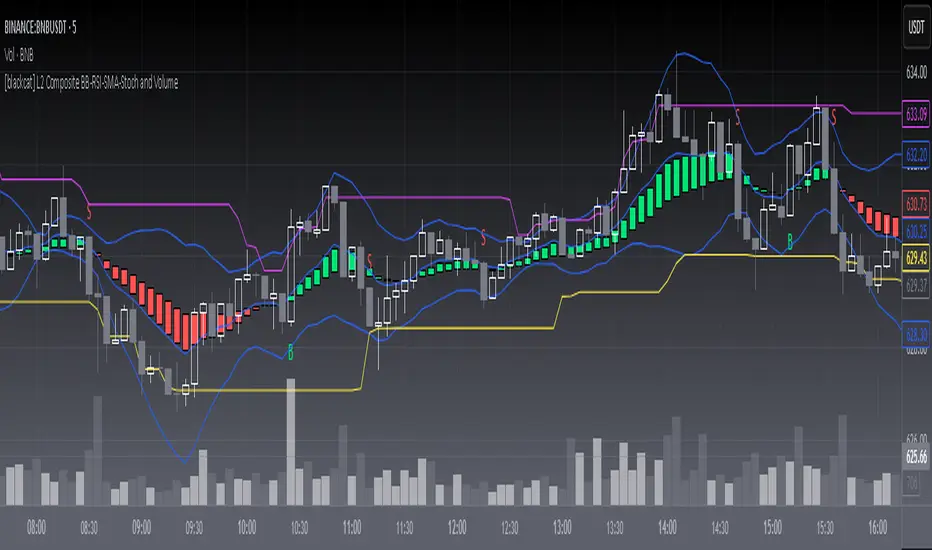
L2 Composite BB-RSI-SMA-Stoch and VolumeLevel: 2
Background
Commonly we cannot use signal indicator to disclose the nature of market. By using multiple indicator resonance, the confidence level of trading is increased. The selection of proper ingredients is important to guarantee a good results.
Function
L2 Composite BB-RSI-SMA-Stoch and Volume script likes a Pizza that you can put your favorite ingredients and condiments. In my menu, there are basic indicators as below:
Bollinger bands are envelopes with a standard deviation above and below a simple moving average of price. Since the spacing of the bands is based on the standard deviation, they adjust to the fluctuations in volatility in the underlying price.
The Relative Strength Index (RSI) developed by J. Welles Wilder is a pulse oscillator that measures the speed and change of price movements. The RSI hovers between zero and 100.
A simple moving average (SMA) is an arithmetic moving average that is calculated by adding up current prices and then dividing by the number of time periods in the calculation average.
A stochastic oscillator is a momentum indicator that compares a certain closing price of a security with a range of its prices over a certain period of time. The sensitivity to market movements can be reduced by adjusting this time period or by taking a moving average of the result.
Volume meters are the ones that make up the volume, usually an underestimated indicator.
Key Signal
Composite signal is simple and difficult to describe the overall function. By simple logic "and", "or", you can filter out the noise and disclose the real market trend.
Pros and Cons
Pros:
1. Higher confidence level for trading due to indicator resonance effect.
2. Incl. long, short, and close, three types of signal.
3. Easy to migrate and adapt to various markets.
Cons:
1. Highly emphasized on long signal, for short signal is a little bit weak.
2. Only use for trading pairs with volume information. Indice is not applicable.
3. Although I tried to use a set of "Golden Parameters", it still need to be tuned along different markets, time frame upon situations.
4. It is complex if you are wondering to introduce new indicator together with them. A lot of efforts may be needed.
Remarks
The opinions of most people in the market may not be correct, but the opinions of most indicators are closer to correct.
Readme
In real life, I am a prolific inventor. I have successfully applied for more than 60 international and regional patents in the past 12 years. But in the past two years or so, I have tried to transfer my creativity to the development of trading strategies. Tradingview is the ideal platform for me. I am selecting and contributing some of the hundreds of scripts to publish in Tradingview community. Welcome everyone to interact with me to discuss these interesting pine scripts.
The scripts posted are categorized into 5 levels according to my efforts or manhours put into these works.
Level 1 : interesting script snippets or distinctive improvement from classic indicators or strategy. Level 1 scripts can usually appear in more complex indicators as a function module or element.
Level 2 : composite indicator/strategy. By selecting or combining several independent or dependent functions or sub indicators in proper way, the composite script exhibits a resonance phenomenon which can filter out noise or fake trading signal to enhance trading confidence level.
Level 3 : comprehensive indicator/strategy. They are simple trading systems based on my strategies. They are commonly containing several or all of entry signal, close signal, stop loss, take profit, re-entry, risk management, and position sizing techniques. Even some interesting fundamental and mass psychological aspects are incorporated.
Level 4 : script snippets or functions that do not disclose source code. Interesting element that can reveal market laws and work as raw material for indicators and strategies. If you find Level 1~2 scripts are helpful, Level 4 is a private version that took me far more efforts to develop.
Level 5 : indicator/strategy that do not disclose source code. private version of Level 3 script with my accumulated script processing skills or a large number of custom functions. I had a private function library built in past two years. Level 5 scripts use many of them to achieve private trading strategy.
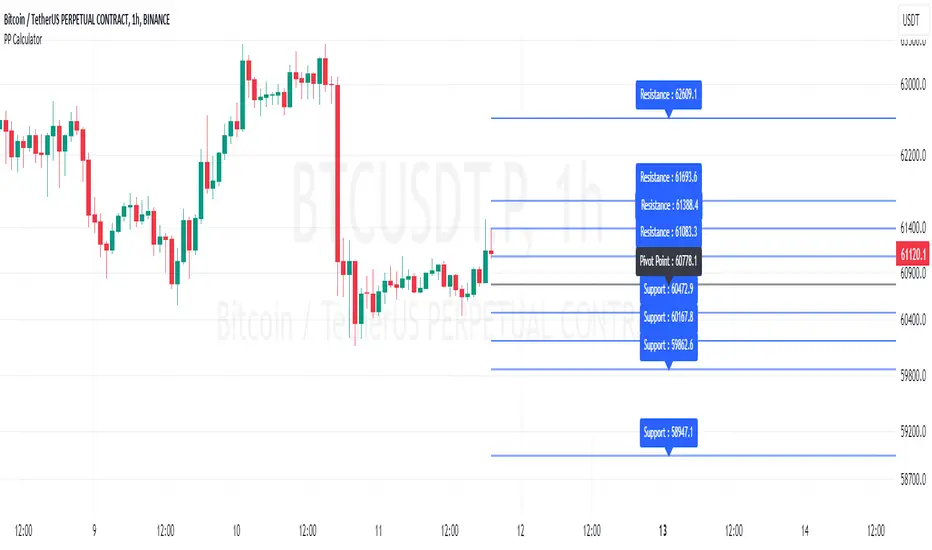
Pivot Point Calculator [JP&Dia]English User Guide
Script Name: Pivot Point Calculator
What Does This Script Do? This script calculates classic and Camarilla pivot points used in financial markets. Pivot points are used to identify key support and resistance levels, and this script helps traders better understand market movements.
How to Use It?
Add the script to your charts on TradingView.
Enter your desired time frame in the “Enter Time Frame” field (e.g., M, W, D).
Choose either or both “Classic Pivot” and “Camarilla Pivot” options to display them.
The script will automatically calculate the pivot points and display them on the chart.
Why Is This Script Unique? This script combines both classic and Camarilla pivot calculations, allowing users to easily utilize both pivot styles through a single script.
How Can People Benefit? Traders can use this script to identify potential buy-sell points and market trends. They can also conduct their market analyses more efficiently and effectively.
Script Adı: Pivot Noktası Hesaplayıcı
Script Ne İşe Yarar? Bu script, finansal piyasalarda kullanılan klasik ve Camarilla pivot noktalarını hesaplar. Pivot noktaları, önemli destek ve direnç seviyelerini belirlemek için kullanılır ve bu script, yatırımcıların piyasa hareketlerini daha iyi anlamalarına yardımcı olur.
Nasıl Kullanılır?
Scripti TradingView’deki grafiklerinize ekleyin.
“Zaman Dilimi Girin” alanına istediğiniz zaman dilimini girin (Örneğin: M, W, D).
“Classic Pivot” ve “Camarilla Pivot” seçeneklerinden birini veya her ikisini de seçerek gösterilmesini sağlayabilirsiniz.
Script otomatik olarak pivot noktalarını hesaplayacak ve grafik üzerinde gösterecektir.
Neden Özgü Bir Script? Bu script, hem klasik hem de Camarilla pivot hesaplamalarını birleştirir ve kullanıcıların her iki pivot stilini de tek bir script üzerinden kolayca kullanmalarını sağlar.
İnsanlar Nasıl Faydalanabilir? Yatırımcılar, bu scripti kullanarak potansiyel alım-satım noktalarını ve piyasa trendlerini belirleyebilirler. Ayrıca, piyasa analizlerini daha verimli ve etkili bir şekilde yapabilirler.
Session Sweeps [LuxAlgo]The Session Sweeps indicator combines ICT-based features for a complete trading methodology involving market sessions, market structure, and fair value gaps to find optimal entry conditions for trading price action.
Traders frequently tend to place stop/limit orders at the high and low points of major trading sessions such as Asian (Tokyo), European (London), and North American (New York), resulting in the establishment of liquidity pools at those particular levels. The Session Sweeps indicator is crafted to recognize and underscore occurrences of session sweeps or liquidity sweeps during these major trading sessions.
🔶 USAGE
Default settings utilize major forex trading sessions, yet users can select their preferred opening and closing times, rename the sessions, or adjust the colors. It's important to note that the specified times for each session align with the respective local timezones: Asian (Tokyo) UTC+9, European (London) UTC, and North American (New York) UTC-5.
If the price briefly crosses either the highest or lowest point of a market session. These movements, aiming at triggering stop losses, suggest potential shifts in the market direction. Detecting such movements is the fundamental purpose and core functionality of the script.
🔹Market Structure Shifts
A Market Structure Shift refers to a change in market direction, either from an uptrend to a downtrend or vice versa. A part of a common entry model when using session sweeps is waiting for the formation of a CHoCH after a session sweep.
🔹Fair Value Gaps
A Fair Value Gap (FVG) holds particular appeal for price action traders, emerging when there are inefficiencies or imbalances in the market, often a result of uneven buying and selling activity. The underlying concept of FVGs is that the market tends to revisit these inefficiencies before resuming its trajectory in alignment with the initial impulsive move.
After the formation of a CHoCH traders can enter a position when the price enters the area of a Fair Value Gap (FVG).
🔹Setup Examples
This entry setup is commonly used by ICT traders and is shared for informational & educational purposes only.
Long Positions (5-Minute Timeframe):
Wait for the previous session's low to be swept.
Look for a Bullish Choch.
Find a Bullish FVG formed by or before the Choch.
Entry Point: At the FVG.
Take Profit (TP): At the session high or aim for a 1:2 Risk-Reward Ratio.
Stop Loss (SL): At the session low or nearest Swing Low.
Take partial profits at intermediate swings, but don’t shift SL prematurely.
Short Positions (5-Minute Timeframe):
Wait for the previous session's high to be swept.
Look for a Bearish Choch.
Find a FVG formed by or before the Choch.
Entry Point: At the FVG.
Take Profit (TP): At the previous session's low or aim for a 1:2 RR.
Stop Loss (SL): At the session high or nearest Swing High.
Take partial profits at intermediate swings, but don’t shift SL prematurely.
🔶 SETTINGS
🔹Session Sweeps
Buyside Sweep Zones, Color, and Margin: toggles the visibility of bullside sweep zones, customizes the associated color, and sets the margin value defining the range of a bullside sweep zone.
Sellside Sweep Zones, Color, and Margin: toggles the visibility of sell-side sweep zones, customizes the associated color, and sets the margin value defining the range of a sell-side sweep zone.
Sweep Margin Length: specifies the maximum allowed length of a sweep zone invalidation, the length over which the price slightly invalidated the margin range.
Detect Sweeps Once per Session: if enabled will detect only once a sweep zone within a session.
Hide Fake Sweep Zones, and Color: controls the visibility and color of the fake sweep zones.
🔹Sessions
Session (Asia, London, New York AM, and New York PM), Start Time, and End Time: enables or disables the visibility of the named market session range, and customization of the session hours.
Color: color customization option of the named session.
Extend Max/Min: extends the highest and lowest price levels of the named session until the end of the next enabled session. This option is recommended to be enabled when sweep zone detection is activated to observe the relationship between the sweep zone and previous session extreme levels.
Extend Mid: extends the mean price levels of the named session until the end of the next enabled session. The extended line may serve as potential support and resistance levels.
Fill: enables/disables background coloring of the named session.
New York DST | London DST: enabling this option initiates Daylight Saving Time (DST) for New York or London. Note: Daylight Saving Time is not applied to the Asian (Tokyo) session.
Sessions Extreme Lines | Sessions Names: toggles the visibility of the highest and lowest price levels, as well as the names, for all market sessions.
Session Lines Width: sets the width of the lines for all sessions.
Session Fill Transparency: sets the background color transparency of the range for all sessions.
🔹Market Structure Shifts
Market Structure Shifts: toggles the visibility of market structure shifts, also known as change of character (CHoCH).
Detection Length: specifies the detection length.
Market Structure Shifts; Bull & Bear: color customization options.
🔹Fair Value Gaps
Fair Value Gaps: toggles the visibility of the fair value gaps.
Fair Value Gap Width Filter: specifies the filtering multiplier; additional details can be found in the tooltip of the respective input option.
Bullish & Bearish Imbalance: color customization options.
🔹Sessions Tabular View
Sessions Tabular View: toggles the visibility of the tabular view of the sessions, displaying date &time, status, and countdown counter.
Hide if not Forex Market Instrument: checks the market and automatically enables/disables the option based on the market instrument.
Table Text Size & Position: size and placement customization options
🔶 LIMITATIONS
Please be aware that fair value gap filtering cannot be applied to the initial 144 candles (with a fixed-length ATR) as the ATR value necessary for filtering won't be available during this period.
🔶 RELATED SCRIPTS
Buyside-Sellside-Liquidity
Sessions
Liquidity-Voids-FVG
Thank you to our community for the recommendation of this script. To explore additional conceptual scripts and related content, we invite you to visit >>> LuxAlgo-Scripts .

HTF Oscillators RSI/ROC/MFI/CCI/AO - Dynamic SmoothingThe Interplay of Time Frames: A Balanced View
Navigating the markets often involves interpreting trends from multiple angles. The HTF Oscillators with Dynamic Smoothing indicator enables you to do just that. This tool provides the option to integrate smoothed oscillator readings from Higher Time Frames (HTF) into lower time frame charts, such as a 1-minute chart. By doing so, the indicator offers a balanced viewpoint that bridges the gap between micro and macro perspectives, helping you make informed decisions without losing sight of the broader market context.
Features
Multi-Oscillator Support
Choose from a range of popular oscillators like the Relative Strength Index (RSI), Rate of Change (ROC), Money Flow Index (MFI), Commodity Channel Index (CCI), and Awesome Oscillator (AO). These oscillators are commonly used as foundational building blocks in trading strategy scripts by traders worldwide. Switch effortlessly between them, depending on your trading strategy and requirements. To maintain consistency and a familiar user experience, our script adopts the same visual aesthetics that you'll find in Pine Script indicators on TradingView: a sleek purple line for the oscillator and a transparent band filling. These visual elements are not only pleasing to the eye but also widely appreciated by the trading community.
Dynamic Smoothing
The unique dynamic smoothing feature calculates a smoothing factor based on the ratio of minutes between the Higher Time Frame (HTF) and your current time frame. This provides a sleek and responsive oscillator line that still holds the weight of the longer trend. One of the significant advantages of this feature is user experience; when you change your time frame, the HTF-values in your settings will remain consistent. This ensures that you can easily switch between different time frames without losing the insights provided by your selected HTF.
Visual Aids
Visual cues are an essential part of any trading strategy. The indicator not only plots signals to mark overbought and oversold conditions based on the dynamically smoothed oscillator but also provides you with the flexibility to customize your visual experience. You have the option to toggle on/off the display of these signals depending on your specific needs. Additionally, bands can be displayed at overbought and oversold levels, along with a reference middle line. If you switch between different oscillators (available in the parameter settings), remember to manually adjust the bands in the input settings to ensure signals matches with the type of oscillator to your liking.
User-Friendly Settings
We've grouped related settings together, making it easier for you to find what you're looking for. Adjust the oscillator type, length of bars, smoothing settings, and more with just a few clicks.
Information Table
A standout feature of this indicator is the real-time information table, which displays the values of all selected oscillators based on your specified Higher Time Frame (HTF) settings. This can be particularly useful for traders who depend on multiple indicators for their decision-making process. The data presented in the table is synchronized with the HTF options you've configured in the input settings, allowing for a more efficient and quick scan of values from higher time frames.
Educational Corner: The Power of the Information Table and Customization
The table incorporated into this indicator isn't just eye-candy; it's a practical tool designed to elevate your trading strategy. It dynamically displays real-time values of various oscillators for the HTF you've chosen. This is an exemplary use of TradingView's scripting capabilities to blend multiple indicators into a single visual panel, streamlining your analysis and decision-making process.
But here's the best part: You're not limited to what we've created. With some basic understanding of TradingView's scripting language, Pine Script, you can easily adapt this table to include different indicators that suit your unique trading style. The logic in the script is modular and can serve as a foundation for your own customized trading dashboard. So, go ahead, get creative and explore new combinations of indicators that will help you excel in your trading endeavors!
You no longer have to toggle between different charts or indicators to get the information you need; it's all there in one neatly organized table. We encourage you to tap into this feature and make it your own, empowering your trading like never before.
By doing so, you not only gain a more comprehensive toolset, but you also engage more deeply with your trading strategy, understanding its nuances and, ultimately, making more informed decisions.
Conclusion
The HTF Oscillators with Dynamic Smoothing is a versatile and powerful tool that brings together the best of both worlds: the perspective of higher time frames and the granularity of shorter ones. Its feature-rich setting options and real-time information table make it a potential useful addition to your trading toolkit.
Remember, while this indicator offers a comprehensive and smarter way to look at the markets, it is not a foolproof method for predicting market movements. Always use it in conjunction with other analysis methods and risk management strategies.
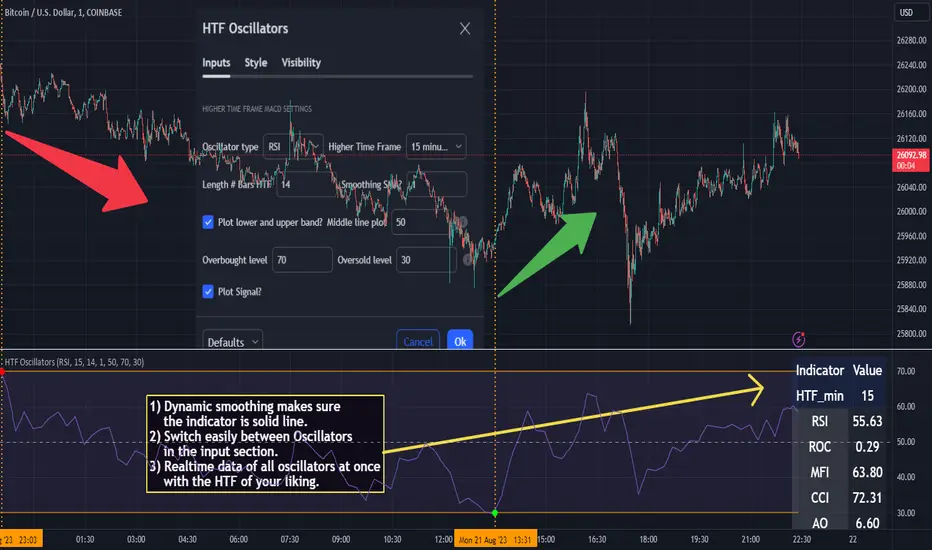
Adaptive Candlestick Pattern Recognition System█ INTRODUCTION
Nearly three years in the making, intermittently worked on in the few spare hours of weekends and time off, this is a passion project I undertook to flesh out my skills as a computer programmer. This script currently recognizes 85 different candlestick patterns ranging from one to five candles in length. It also performs statistical analysis on those patterns to determine prior performance and changes the coloration of those patterns based on that performance. In searching TradingView's script library for scripts similar to this one, I had found a handful. However, when I reviewed the ones which were open source, I did not see many that truly captured the power of PineScrypt or leveraged the way it works to create efficient and reliable code; one of the main driving factors for releasing this 5,000+ line behemoth open sourced.
Please take the time to review this description and source code to utilize this script to its fullest potential.
█ CONCEPTS
This script covers the following topics: Candlestick Theory, Trend Direction, Higher Timeframes, Price Analysis, Statistic Analysis, and Code Design.
Candlestick Theory - This script focuses solely on the concept of Candlestick Theory: arrangements of candlesticks may form certain patterns that can potentially influence the future price action of assets which experience those patterns. A full list of patterns (grouped by pattern length) will be in its own section of this description. This script contains two modes of operation for identifying candlestick patterns, 'CLASSIC' and 'BREAKOUT'.
CLASSIC: In this mode, candlestick patterns will be identified whenever they appear. The user has a wide variety of inputs to manipulate that can change how certain patterns are identified and even enable alerts to notify themselves when these patterns appear. Each pattern selected to appear will have their Profit or Loss (P/L) calculated starting from the first candle open succeeding the pattern to a candle close specified some number of candles ahead. These P/L calculations are then collected for each pattern, and split among partitions of prior price action of the asset the script is currently applied to (more on that in Higher Timeframes ).
BREAKOUT: In this mode, P/L calculations are held off until a breakout direction has been confirmed. The user may specify the number of candles ahead of a pattern's appearance (from one to five) that a pattern has to confirm a breakout in either an upward or downward direction. A breakout is constituted when there is a candle following the appearance of the pattern that closes above/at the highest high of the pattern, or below/at its lowest low. Only then will percent return calculations be performed for the pattern that's been identified, and these percent returns are broken up not only by the partition they had appeared in but also by the breakout direction itself. Patterns which do not breakout in either direction will be ignored, along with having their labels deleted.
In both of these modes, patterns may be overridden. Overrides occur when a smaller pattern has been detected and ends up becoming one (or more) of the candles of a larger pattern. A key example of this would be the Bearish Engulfing and the Three Outside Down patterns. A Three Outside Down necessitates a Bearish Engulfing as the first two candles in it, while the third candle closes lower. When a pattern is overridden, the return for that pattern will no longer be tracked. Overrides will not occur if the tail end of a larger pattern occurs at the beginning of a smaller pattern (Ex: a Bullish Engulfing occurs on the third candle of a Three Outside Down and the candle immediately following that pattern, the Three Outside Down pattern will not be overridden).
Important Functionality Note: These patterns are only searched for at the most recently closed candle, not on the currently closing candle, which creates an offset of one for this script's execution. (SEE LIMITATIONS)
Trend Direction - Many of the patterns require a trend direction prior to their appearance. Noting TradingView's own publication of candlestick patterns, I utilize a similar method for determining trend direction. Moving Averages are used to determine which trend is currently taking place for candlestick patterns to be sought out. The user has access to two Moving Averages which they may individually modify the following for each: Moving Average type (list of 9), their length, width, source values, and all variables associated with two special Moving Averages (Least Squares and Arnaud Legoux).
There are 3 settings for these Moving Averages, the first two switch between the two Moving Averages, and the third uses both. When using individual Moving Averages, the user may select a 'price point' to compare against the Moving Average (default is close). This price point is compared to the Moving Average at the candles prior to the appearance of candle patterns. Meaning: The close compared to the Moving Average two candles behind determines the trend direction used for Candlestick Analysis of one candle patterns; three candles behind for two candle patterns and so on. If the selected price point is above the Moving Average, then the current trend is an 'uptrend', 'downtrend' otherwise.
The third setting using both Moving Averages will compare the lengths of each, and trend direction is determined by the shorter Moving Average compared to the longer one. If the shorter Moving Average is above the longer, then the current trend is an 'uptrend', 'downtrend' otherwise. If the lengths of the Moving Averages are the same, or both Moving Averages are Symmetrical, then MA1 will be used by default. (SEE LIMITATIONS)
Higher Timeframes - This script employs the use of Higher Timeframes with a few request.security calls. The purpose of these calls is strictly for the partitioning of an asset's chart, splitting the returns of patterns into three separate groups. The four inputs in control of this partitioning split the chart based on: A given resolution to grab values from, the length of time in that resolution, and 'Upper' and 'Lower Limits' which split the trading range provided by that length of time in that resolution that forms three separate groups. The default values for these four inputs will partition the current chart by the yearly high-low range where: the 'Upper' partition is the top 20% of that trading range, the 'Middle' partition is 80% to 33% of the trading range, and the 'Lower' partition covers the trading range within 33% of the yearly low.
Patterns which are identified by this script will have their returns grouped together based on which partition they had appeared in. For example, a Bullish Engulfing which occurs within a third of the yearly low will have its return placed separately from a Bullish Engulfing that occurred within 20% of the yearly high. The idea is that certain patterns may perform better or worse depending on when they had occurred during an asset's trading range.
Price Analysis - Price Analysis is a major part of this script's functionality as it can fundamentally change how patterns are shown to the user. The settings related to Price Analysis include setting the number of candles ahead of a pattern's appearance to determine the return of that pattern. In 'BREAKOUT' mode, an additional setting allows the user to specify where the P/L calculation will begin for a pattern that had appeared and confirmed. (SEE LIMITATIONS)
The calculation for percent returns of patterns is illustrated with the following pseudo-code (CLASSIC mode, this is a simplified version of the actual code):
type patternObj
int ID
int partition
type returnsArray
float returns
// No pattern found = na returned
patternObj TEST_VAL = f_FindPattern()
priorTestVal = TEST_VAL
if not na( priorTestVal )
pnlMatrixRow = priorTestVal.ID
pnlMatrixCol = priorTestVal.partition
matrixReturn = matrix.get(PERCENT_RETURNS, pnlMatrixRow, pnlMatrixCol)
percentReturn = ( (close - open ) / open ) * 100%
array.push(matrixReturn.returns, percentReturn)
Statistic Analysis - This script uses Pine's built-in array functions to conduct the Statistic Analysis for patterns. When a pattern is found and its P/L calculation is complete, its return is added to a 'Return Array' User-Defined-Type that contains numerous fields which retain information on a pattern's prior performance. The actual UDT is as follows:
type returnArray
float returns = na
int size = 0
float avg = 0
float median = 0
float stdDev = 0
int polarities = na
All values within this UDT will be updated when a return is added to it (some based on user input). The array.avg , array.median and array.stdev will be ran and saved into their respective fields after a return is placed in the 'returns' array. The 'polarities' integer array is what will be changed based on user input. The user specifies two different percentages that declare 'Positive' and 'Negative' returns for patterns. When a pattern returns above, below, or in between these two values, different indices of this array will be incremented to reflect the kind of return that pattern had just experienced.
These values (plus the full name, partition the pattern occurred in, and a 95% confidence interval of expected returns) will be displayed to the user on the tooltip of the labels that identify patterns. Simply scroll over the pattern label to view each of these values.
Code Design - Overall this script is as much of an art piece as it is functional. Its design features numerous depictions of ASCII Art that illustrate what is being attempted by the functions that identify patterns, and an incalculable amount of time was spent rewriting portions of code to improve its efficiency. Admittedly, this final version is nearly 1,000 lines shorter than a previous version (one which took nearly 30 seconds after compilation to run, and didn't do nearly half of what this version does). The use of UDTs, especially the 'patternObj' one crafted and redesigned from the Hikkake Hunter 2.0 I published last month, played a significant role in making this script run efficiently. There is a slight rigidity in some of this code mainly around pattern IDs which are responsible for displaying the abbreviation for patterns (as well as the full names under the tooltips, and the matrix row position for holding returns), as each is hard-coded to correspond to that pattern.
However, one thing I would like to mention is the extensive use of global variables for pattern detection. Many scripts I had looked over for ideas on how to identify candlestick patterns had the same idea; break the pattern into a set of logical 'true/false' statements derived from historically referencing candle OHLC values. Some scripts which identified upwards of 20 to 30 patterns would reference Pine's built-in OHLC values for each pattern individually, potentially requesting information from TradingView's servers numerous times that could easily be saved into a variable for re-use and only requested once per candle (what this script does).
█ FEATURES
This script features a massive amount of switches, options, floating point values, detection settings, and methods for identifying/tailoring pattern appearances. All modifiable inputs for patterns are grouped together based on the number of candles they contain. Other inputs (like those for statistics settings and coloration) are grouped separately and presented in a way I believe makes the most sense.
Not mentioned above is the coloration settings. One of the aims of this script was to make patterns visually signify their behavior to the user when they are identified. Each pattern has its own collection of returns which are analyzed and compared to the inputs of the user. The user may choose the colors for bullish, neutral, and bearish patterns. They may also choose the minimum number of patterns needed to occur before assigning a color to that pattern based on its behavior; a color for patterns that have not met this minimum number of occurrences yet, and a color for patterns that are still processing in BREAKOUT mode.
There are also an additional three settings which alter the color scheme for patterns: Statistic Point-of-Reference, Adaptive coloring, and Hard Limiting. The Statistic Point-of-Reference decides which value (average or median) will be compared against the 'Negative' and 'Positive Return Tolerance'(s) to guide the coloration of the patterns (or for Adaptive Coloring, the generation of a color gradient).
Adaptive Coloring will have this script produce a gradient that patterns will be colored along. The more bullish or bearish a pattern is, the further along the gradient those patterns will be colored starting from the 'Neutral' color (hard lined at the value of 0%: values above this will be colored bullish, bearish otherwise). When Adaptive Coloring is enabled, this script will request the highest and lowest values (these being the Statistic Point-of-Reference) from the matrix containing all returns and rewrite global variables tied to the negative and positive return tolerances. This means that all patterns identified will be compared with each other to determine bullish/bearishness in Adaptive Coloring.
Hard Limiting will prevent these global variables from being rewritten, so patterns whose Statistic Point-of-Reference exceed the return tolerances will be fully colored the bullish or bearish colors instead of a generated gradient color. (SEE LIMITATIONS)
Apart from the Candle Detection Modes (CLASSIC and BREAKOUT), there's an additional two inputs which modify how this script behaves grouped under a "MASTER DETECTION SETTINGS" tab. These two "Pattern Detection Settings" are 'SWITCHBOARD' and 'TARGET MODE'.
SWITCHBOARD: Every single pattern has a switch that is associated with its detection. When a switch is enabled, the code which searches for that pattern will be run. With the Pattern Detection Setting set to this, all patterns that have their switches enabled will be sought out and shown.
TARGET MODE: There is an additional setting which operates on top of 'SWITCHBOARD' that singles out an individual pattern the user specifies through a drop down list. The names of every pattern recognized by this script will be present along with an identifier that shows the number of candles in that pattern (Ex: " (# candles)"). All patterns enabled in the switchboard will still have their returns measured, but only the pattern selected from the "Target Pattern" list will be shown. (SEE LIMITATIONS)
The vast majority of other features are held in the one, two, and three candle pattern sections.
For one-candle patterns, there are:
3 — Settings related to defining 'Tall' candles:
The number of candles to sample for previous candle-size averages.
The type of comparison done for 'Tall' Candles: Settings are 'RANGE' and 'BODY'.
The 'Tolerance' for tall candles, specifying what percent of the 'average' size candles must exceed to be considered 'Tall'.
When 'Tall Candle Setting' is set to RANGE, the high-low ranges are what the current candle range will be compared against to determine if a candle is 'Tall'. Otherwise the candle bodies (absolute value of the close - open) will be compared instead. (SEE LIMITATIONS)
Hammer Tolerance - How large a 'discarded wick' may be before it disqualifies a candle from being a 'Hammer'.
Discarded wicks are compared to the size of the Hammer's candle body and are dependent upon the body's center position. Hammer bodies closer to the high of the candle will have the upper wick used as its 'discarded wick', otherwise the lower wick is used.
9 — Doji Settings, some pulled from an old Doji Hunter I made a while back:
Doji Tolerance - How large the body of a candle may be compared to the range to be considered a 'Doji'.
Ignore N/S Dojis - Turns off Trend Direction for non-special Dojis.
GS/DF Doji Settings - 2 Inputs that enable and specify how large wicks that typically disqualify Dojis from being 'Gravestone' or 'Dragonfly' Dojis may be.
4 Settings related to 'Long Wick Doji' candles detailed below.
A Tolerance for 'Rickshaw Man' Dojis specifying how close the center of the body must be to the range to be valid.
The 4 settings the user may modify for 'Long Legged' Dojis are: A Sample Base for determining the previous average of wicks, a Sample Length specifying how far back to look for these averages, a Behavior Setting to define how 'Long Legged' Dojis are recognized, and a tolerance to specify how large in comparison to the prior wicks a Doji's wicks must be to be considered 'Long Legged'.
The 'Sample Base' list has two settings:
RANGE: The wicks of prior candles are compared to their candle ranges and the 'wick averages' will be what the average percent of ranges were in the sample.
WICKS: The size of the wicks themselves are averaged and returned for comparing against the current wicks of a Doji.
The 'Behavior' list has three settings:
ONE: Only one wick length needs to exceed the average by the tolerance for a Doji to be considered 'Long Legged'.
BOTH: Both wick lengths need to exceed the average of the tolerance of their respective wicks (upper wicks are compared to upper wicks, lower wicks compared to lower) to be considered 'Long Legged'.
AVG: Both wicks and the averages of the previous wicks are added together, divided by two, and compared. If the 'average' of the current wicks exceeds this combined average of prior wicks by the tolerance, then this would constitute a valid 'Long Legged' Doji. (For Dojis in general - SEE LIMITATIONS)
The final input is one related to candle patterns which require a Marubozu candle in them. The two settings for this input are 'INCLUSIVE' and 'EXCLUSIVE'. If INCLUSIVE is selected, any opening/closing variant of Marubozu candles will be allowed in the patterns that require them.
For two-candle patterns, there are:
2 — Settings which define 'Engulfing' parameters:
Engulfing Setting - Two options, RANGE or BODY which sets up how one candle may 'engulf' the previous.
Inclusive Engulfing - Boolean which enables if 'engulfing' candles can be equal to the values needed to 'engulf' the prior candle.
For the 'Engulfing Setting':
RANGE: If the second candle's high-low range completely covers the high-low range of the prior candle, this is recognized as 'engulfing'.
BODY: If the second candle's open-close completely covers the open-close of the previous candle, this is recognized as 'engulfing'. (SEE LIMITATIONS)
4 — Booleans specifying different settings for a few patterns:
One which allows for 'opens within body' patterns to let the second candle's open/close values match the prior candles' open/close.
One which forces 'Kicking' patterns to have a gap if the Marubozu setting is set to 'INCLUSIVE'.
And Two which dictate if the individual candles in 'Stomach' patterns need to be 'Tall'.
8 — Floating point values which affect 11 different patterns:
One which determines the distance the close of the first candle in a 'Hammer Inverted' pattern must be to the low to be considered valid.
One which affects how close the opens/closes need to be for all 'Lines' patterns (Bull/Bear Meeting/Separating Lines).
One that allows some leeway with the 'Matching Low' pattern (gives a small range the second candle close may be within instead of needing to match the previous close).
Three tolerances for On Neck/In Neck patterns (2 and 1 respectively).
A tolerance for the Thrusting pattern which give a range the close the second candle may be between the midpoint and close of the first to be considered 'valid'.
A tolerance for the two Tweezers patterns that specifies how close the highs and lows of the patterns need to be to each other to be 'valid'.
The first On Neck tolerance specifies how large the lower wick of the first candle may be (as a % of that candle's range) before the pattern is invalidated. The second tolerance specifies how far up the lower wick to the close the second candle's close may be for this pattern. The third tolerance for the In Neck pattern determines how far into the body of the first candle the second may close to be 'valid'.
For the remaining patterns (3, 4, and 5 candles), there are:
3 — Settings for the Deliberation pattern:
A boolean which forces the open of the third candle to gap above the close of the second.
A tolerance which changes the proximity of the third candle's open to the second candle's close in this pattern.
A tolerance that sets the maximum size the third candle may be compared to the average of the first two candles.
One boolean value for the Two Crows patterns (standard and Upside Gapping) that forces the first two candles in the patterns to completely gap if disabled (candle 1's close < candle 2's low).
10 — Floating point values for the remaining patterns:
One tolerance for defining how much the size of each candle in the Identical Black Crows pattern may deviate from the average of themselves to be considered valid.
One tolerance for setting how close the opens/closes of certain three candle patterns may be to each other's opens/closes.*
Three floating point values that affect the Three Stars in the South pattern.
One tolerance for the Side-by-Side patterns - looks at the second and third candle closes.
One tolerance for the Stick Sandwich pattern - looks at the first and third candle closes.
A floating value that sizes the Concealing Baby Swallow pattern's 3rd candle wick.
Two values for the Ladder Bottom pattern which define a range that the third candle's wick size may be.
* This affects the Three Black Crows (non-identical) and Three White Soldiers patterns, each require the opens and closes of every candle to be near each other.
The first tolerance of the Three Stars in the South pattern affects the first candle body's center position, and defines where it must be above to be considered valid. The second tolerance specifies how close the second candle must be to this same position, as well as the deviation the ratio the candle body to its range may be in comparison to the first candle. The third restricts how large the second candle range may be in comparison to the first (prevents this pattern from being recognized if the second candle is similar to the first but larger).
The last two floating point values define upper and lower limits to the wick size of a Ladder Bottom's fourth candle to be considered valid.
█ HOW TO USE
While there are many moving parts to this script, I attempted to set the default values with what I believed may help identify the most patterns within reasonable definitions. When this script is applied to a chart, the Candle Detection Mode (along with the BREAKOUT settings) and all candle switches must be confirmed before patterns are displayed. All switches are on by default, so this gives the user an opportunity to pick which patterns to identify first before playing around in the settings.
All of the settings/inputs described above are meant for experimentation. I encourage the user to tweak these values at will to find which set ups work best for whichever charts they decide to apply these patterns to.
Refer to the patterns themselves during experimentation. The statistic information provided on the tooltips of the patterns are meant to help guide input decisions. The breadth of candlestick theory is deep, and this was an attempt at capturing what I could in its sea of information.
█ LIMITATIONS
DISCLAIMER: While it may seem a bit paradoxical that this script aims to use past performance to potentially measure future results, past performance is not indicative of future results . Markets are highly adaptive and often unpredictable. This script is meant as an informational tool to show how patterns may behave. There is no guarantee that confidence intervals (or any other metric measured with this script) are accurate to the performance of patterns; caution must be exercised with all patterns identified regardless of how much information regarding prior performance is available.
Candlestick Theory - In the name, Candlestick Theory is a theory , and all theories come with their own limits. Some patterns identified by this script may be completely useless/unprofitable/unpredictable regardless of whatever combination of settings are used to identify them. However, if I truly believed this theory had no merit, this script would not exist. It is important to understand that this is a tool meant to be utilized with an array of others to procure positive (or negative, looking at you, short sellers ) results when navigating the complex world of finance.
To address the functionality note however, this script has an offset of 1 by default. Patterns will not be identified on the currently closing candle, only on the candle which has most recently closed. Attempting to have this script do both (offset by one or identify on close) lead to more trouble than it was worth. I personally just want users to be aware that patterns will not be identified immediately when they appear.
Trend Direction - Moving Averages - There is a small quirk with how MA settings will be adjusted if the user inputs two moving averages of the same length when the "MA Setting" is set to 'BOTH'. If Moving Averages have the same length, this script will default to only using MA 1 regardless of if the types of Moving Averages are different . I will experiment in the future to alleviate/reduce this restriction.
Price Analysis - BREAKOUT mode - With how identifying patterns with a look-ahead confirmation works, the percent returns for patterns that break out in either direction will be calculated on the same candle regardless of if P/L Offset is set to 'FROM CONFIRMATION' or 'FROM APPEARANCE'. This same issue is present in the Hikkake Hunter script mentioned earlier. This does not mean the P/L calculations are incorrect , the offset for the calculation is set by the number of candles required to confirm the pattern if 'FROM APPEARANCE' is selected. It just means that these two different P/L calculations will complete at the same time independent of the setting that's been selected.
Adaptive Coloring/Hard Limiting - Hard Limiting is only used with Adaptive Coloring and has no effect outside of it. If Hard Limiting is used, it is recommended to increase the 'Positive' and 'Negative' return tolerance values as a pattern's bullish/bearishness may be disproportionately represented with the gradient generated under a hard limit.
TARGET MODE - This mode will break rules regarding patterns that are overridden on purpose. If a pattern selected in TARGET mode would have otherwise been absorbed by a larger pattern, it will have that pattern's percent return calculated; potentially leading to duplicate returns being included in the matrix of all returns recognized by this script.
'Tall' Candle Setting - This is a wide-reaching setting, as approximately 30 different patterns or so rely on defining 'Tall' candles. Changing how 'Tall' candles are defined whether by the tolerance value those candles need to exceed or by the values of the candle used for the baseline comparison (RANGE/BODY) can wildly affect how this script functions under certain conditions. Refer to the tooltip of these settings for more information on which specific patterns are affected by this.
Doji Settings - There are roughly 10 or so two to three candle patterns which have Dojis as a part of them. If all Dojis are disabled, it will prevent some of these larger patterns from being recognized. This is a dependency issue that I may address in the future.
'Engulfing' Setting - Functionally, the two 'Engulfing' settings are quite different. Because of this, the 'RANGE' setting may cause certain patterns that would otherwise be valid under textbook and online references/definitions to not be recognized as such (like the Upside Gap Two Crows or Three Outside down).
█ PATTERN LIST
This script recognizes 85 patterns upon initial release. I am open to adding additional patterns to it in the future and any comments/suggestions are appreciated. It recognizes:
15 — 1 Candle Patterns
4 Hammer type patterns: Regular Hammer, Takuri Line, Shooting Star, and Hanging Man
9 Doji Candles: Regular Dojis, Northern/Southern Dojis, Gravestone/Dragonfly Dojis, Gapping Up/Down Dojis, and Long-Legged/Rickshaw Man Dojis
White/Black Long Days
32 — 2 Candle Patterns
4 Engulfing type patterns: Bullish/Bearish Engulfing and Last Engulfing Top/Bottom
Dark Cloud Cover
Bullish/Bearish Doji Star patterns
Hammer Inverted
Bullish/Bearish Haramis + Cross variants
Homing Pigeon
Bullish/Bearish Kicking
4 Lines type patterns: Bullish/Bearish Meeting/Separating Lines
Matching Low
On/In Neck patterns
Piercing pattern
Shooting Star (2 Lines)
Above/Below Stomach patterns
Thrusting
Tweezers Top/Bottom patterns
Two Black Gapping
Rising/Falling Window patterns
29 — 3 Candle Patterns
Bullish/Bearish Abandoned Baby patterns
Advance Block
Collapsing Doji Star
Deliberation
Upside/Downside Gap Three Methods patterns
Three Inside/Outside Up/Down patterns (4 total)
Bullish/Bearish Side-by-Side patterns
Morning/Evening Star patterns + Doji variants
Stick Sandwich
Downside/Upside Tasuki Gap patterns
Three Black Crows + Identical variation
Three White Soldiers
Three Stars in the South
Bullish/Bearish Tri-Star patterns
Two Crows + Upside Gap variant
Unique Three River Bottom
3 — 4 Candle Patterns
Concealing Baby Swallow
Bullish/Bearish Three Line Strike patterns
6 — 5 Candle Patterns
Bullish/Bearish Breakaway patterns
Ladder Bottom
Mat Hold
Rising/Falling Three Methods patterns
█ WORKS CITED
Because of the amount of time needed to complete this script, I am unable to provide exact dates for when some of these references were used. I will also not provide every single reference, as citing a reference for each individual pattern and the place it was reviewed would lead to a bibliography larger than this script and its description combined. There were five major resources I used when building this script, one book, two websites (for various different reasons including patterns, moving averages, and various other articles of information), various scripts from TradingView's public library (including TradingView's own source code for *all* candle patterns ), and PineScrypt's reference manual.
Bulkowski, Thomas N. Encyclopedia of Candlestick Patterns . Hoboken, New Jersey: John Wiley & Sons Inc., 2008. E-book (google books).
Various. Numerous webpages. CandleScanner . 2023. online. Accessed 2020 - 2023.
Various. Numerous webpages. Investopedia . 2023. online. Accessed 2020 - 2023.
█ AKNOWLEDGEMENTS
I want to take the time here to thank all of my friends and family, both online and in real life, for the support they've given me over the last few years in this endeavor. My pets who tried their hardest to keep me from completing it. And work for the grit to continue pushing through until this script's completion.
This belongs to me just as much as it does anyone else. Whether you are an institutional trader, gold bug hedging against the dollar, retail ape who got in on a squeeze, or just parents trying to grow their retirement/save for the kids. This belongs to everyone.
Private Beta for new features to be tested can be found here .
Vires In Numeris

BT Leading Candle IndicatorThe oscillator display consists of 3 lines (K, D and J - hence the name of the display) and 2 levels. K and D are the same lines you see when using the stochastic oscillator. The J line in turn represents the deviation of the D value from the K value. The convergence of these lines indicates new trading opportunities. Just like the Stochastic Oscillator, oversold and overbought levels correspond to the times when the trend is likely to reverse.
Function
BT Leading KDJ Candle Indicator use candles to indicate KD relationship. E.g. yellow candles for bull (K>=D) and fuchsia candles for bear (K=D and fuchsia for K KDJ K value
d --> KDJ D value
buysig --> KD buy signal in green triangle
selsig --> KD sell signal in red triangle
leadingline --> colorful leading line for KDJ
Pros and Cons
Pros:
1. Candle height can indicates the strength of trend and different colors are used for indicating KD relationship
2. a leading line is added as aux method to confirm KDJ signal
Cons:
1. It may satruate for extreme conditions of long and short as described in the chart, which is inherent KDJ shortcoming.
2. Not accurate for long and short entries and need filtering out noise and fake signal.
Remarks
More direct to observe and confirm trend with the leading line.
Read me
In real life, I am a prolific inventor. I have successfully applied for more than 60 international and regional patents in the past 12 years. But in the past two years or so, I have tried to transfer my creativity to the development of trading strategies. Trading view is the ideal platform for me. I am selecting and contributing some of the hundreds of scripts to publish in Trading view community. Welcome everyone to interact with me to discuss these interesting pine scripts.
The scripts posted are categorized into 5 levels according to my efforts or man hours put into these works.
Level 1 : interesting script snippets or distinctive improvement from classic indicators or strategy. Level 1 scripts can usually appear in more complex indicators as a function module or element.
Level 2 : composite indicator/strategy. By selecting or combining several independent or dependent functions or sub indicators in proper way, the composite script exhibits a resonance phenomenon which can filter out noise or fake trading signal to enhance trading confidence level.
Level 3 : comprehensive indicator/strategy. They are simple trading systems based on my strategies. They are commonly containing several or all of entry signal, close signal, stop loss, take profit, re-entry, risk management, and position sizing techniques. Even some interesting fundamental and mass psychological aspects are incorporated.
Level 4 : script snippets or functions that do not disclose source code. Interesting element that can reveal market laws and work as raw material for indicators and strategies. If you find Level 1~2 scripts are helpful, Level 4 is a private version that took me far more efforts to develop.
Level 5 : indicator/strategy that do not disclose source code. private version of Level 3 script with my accumulated script processing skills or a large number of custom functions. I had a private function library built in past two years. Level 5 scripts use many
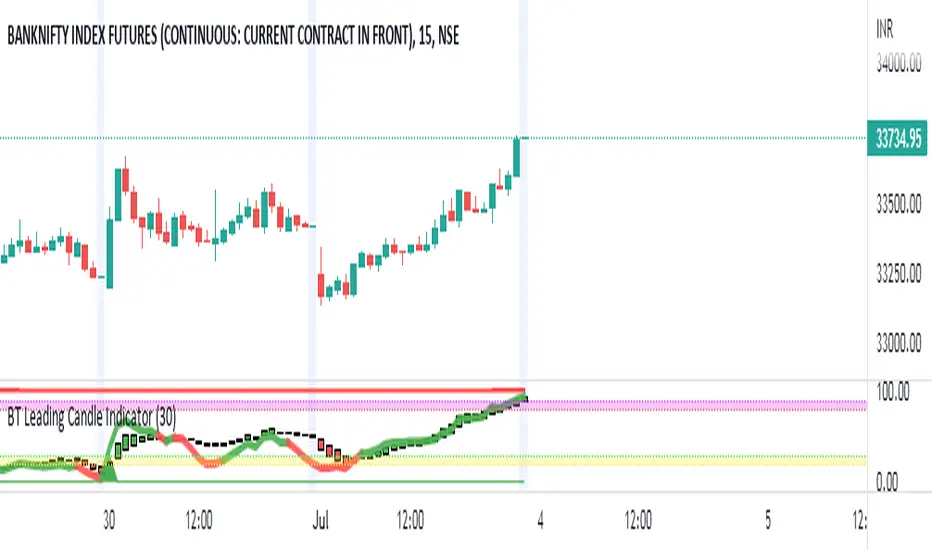
CAGR Custom Range█ OVERVIEW
This script calculates an annualized Compound Annual Growth Rate from two points in time which you can select on the chart. It previews an upcoming feature where Pine scripts will be able to provide users with interactive inputs for time and price values.
👉🏼 We are looking for feedback on our first take of this feature.
Please comment in this publication's "Comments" section if you have suggestions for improvement.
█ HOW TO USE IT
When you first load this script on a chart, you will enter the new interactive selection mode. At that point, the script is waiting for you to pick two points in time on your chart by clicking on the chart. Once you select the two points, the script will find the close value for each of the two selected bars, and calculate the CAGR value from them. It will then display a line between the two points, and the CAGR value above or below the last point in time.
If the CAGR value is positive, the line and label will display in their "up" color (see the "🠅" color in the script's "Settings/Inputs" tab), otherwise they appear in their "down" color (the "🠇" color in the inputs). You can also control the line's width from the inputs.
You have the option of comparing the chart's CAGR value with that of another symbol, which you specify in the "Compare to" input. When a comparison is made, the label's background color will be dependent on the result of the comparison. The line's color will still be determined by the chart's value.
Once time points have been selected on the chart and the script is displaying the line, you can change the time points by clicking on the script's name on the chart. A small, blue rectangular handle will then appear for each point, which you can then grab and move. If you reset the inputs using the "Defaults/Reset Settings" button in the script's inputs, the two time points will reset to the beginning of September and October 2021, respectively.
█ CONCEPTS
The CAGR is a notional, annualized growth rate that assumes all profits are reinvested. It calculates from the close value of the two end points. It does not account for drawdowns, so it does not calculate risk. It can be used as a yardstick to compare the performance of two instruments. Because it annualizes values, the function requires a minimum of one day between the two end points (annualizing returns over smaller periods of times doesn't produce very meaningful figures).
█ LIMITATIONS
• The two selected points must be distant from a minimum of one day. A runtime error will occur otherwise.
• There is currently no way to restart the interactive mode from scratch without re-adding the script to the chart.
• The points in time you select on one chart may map quite differently on other charts,
depending on their constituent bars (e.g., intraday charts for 24x7 and conventional markets).
█ FOR PINE CODERS
• Our script uses the most recent version of Pine, as the `//@version=5` compiler directive indicates.
• Interactive inputs were a long-standing and highly-requested feature by our beloved community of Pine coders.
We hope you find this first step promising, as it opens up entirely new possibilities for both Pine coders and script users.
You can, for example, use interactive inputs to draw shapes with your scripts, or support and resistance levels, etc.
We're sure you'll come up with more creative uses of the feature than we could ever dream up )
• Interactive inputs are implemented for input.time() and input.price() , the specialized input functions now available in v5.
See the User Manual's new page on inputs for more information about them.
You can also create one interactive input for both time and price values
by using the same `inline` argument in a pair of input.time() and input.price() function calls.
• Our min/max filtering when initializing `entryTime` and `exitTime` will handle cases where
the script user inverts the two points on the chart.
• The script uses the new runtime.error() function to throw an error in the `if days < 1` conditional structure.
• We use the `cagr()` function from our recently-published ta Pine library .
Pine libraries — not to be confused with the Public Library showcasing scripts published by our community of Pine coders —
are one of the new features available with the recent Pine v5.
• Note that our `strRightOf()` function cannot be used to generate ticker identifier strings for use in `request.*()` functions.
This is because it produces results of "series" form while the functions require
arguments of "simple" form for their `symbol` or `ticker` parameters.
Have a look at our new User Manual page on Pine's Type system if you need to brush up on Pine forms and types.
• We use a simple, repainting request.security() call because our calculations are not used to generate orders or alerts.
• We document our user-defined functions using the same compiler directives used in exported functions in libraries.
It will make conversion of those functions to library format easier if we ever choose to do so.
• We use two Unicode hair spaces (U+200A) to push the "%" sign slightly away from values in our str.format() calls.
While the impact is minimal, it increases readability.
• Note the `priceIsHigh` logic used to determine if we place the label above or below bars.
When price is higher than recent prices, we place the label above the bar, otherwise we place it below.
It's not foolproof but it provides optimal positioning most of the time.
• The point of the complicated "bool" expression initializing `displayCAGR` is to ensure that we only draw the line and labels once.
When no comparison with another symbol is made, this occurs the first time we encounter a non- na value from the `cagr()` function.
When a comparison is required, it occurs the first time both values are not na .
• Before all mentions of "CAGR" in our description, we use a Unicode zero-width space (U+200B)
to prevent the auto-linking feature to kick in for the term.
This prevents the dashed underscore and a link like this (CAGR) from appearing every time "CAGR" is mentioned.
• With Pine v5, the `study()` declaration statement was renamed to indicator() .
Accordingly, we will be eliminating the use of the "study" term from documentation and the UI.
The generic "script" term will continue to designate Pine code that can be an indicator, a strategy or a library, when applicable.
• We followed our new Style guide recommendations to write our script.
• We used the techniques explained in the How We Write and Format Script Descriptions publication by PineCoders.
• That's it! We've covered all the new features and tricks we used. We sincerely hope you enjoy the new interactive inputs,
and please remember to comment here if you have suggestions for improvement. 💙
Look first. Then leap.
